1,115
Views
9
CrossRef citations to date
0
Altmetric
Research Paper

Nine μg intradermal influenza vaccine and 15 μg intramuscular influenza vaccine induce similar cellular and humoral immune responses in adults

, , , , , , , , & show all
Pages 2713-2720 | Received 28 Mar 2014, Accepted 23 Jun 2014, Published online: 20 Dec 2014

Figures & data

Figure 1. Humoral immune response in subjects receiving the ID and IM influenza vaccines (A) Geometric mean titers (GMTs) at days 0, 14, 21, and 180. (B) Seroprotection rates pre-vaccination (day 0) and at post-vaccination days 14, 21, and 180. Seroprotection was defined as a HI titer ≥40. (C) Seroconversion rates at post-vaccination days 14, 21, and 180. Seroconversion was defined as a post-vaccination HI titer ≥40 in subjects with a pre-vaccination titer <10 or a ≥4-fold increase compared with pre-vaccination titer in subjects with a pre-vaccination titer ≥10. (D) Geometric mean titer ratios (GMTRs). The GMTR was the ratio of post-vaccination HI titer vs. the pre-vaccination titer (day 0). Bars indicate means and error bars indicate 95% CI.
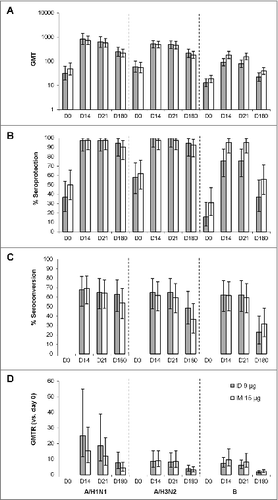
Figure 1. Humoral immune response in subjects receiving the ID and IM influenza vaccines (A) Geometric mean titers (GMTs) at days 0, 14, 21, and 180. (B) Seroprotection rates pre-vaccination (day 0) and at post-vaccination days 14, 21, and 180. Seroprotection was defined as a HI titer ≥40. (C) Seroconversion rates at post-vaccination days 14, 21, and 180. Seroconversion was defined as a post-vaccination HI titer ≥40 in subjects with a pre-vaccination titer <10 or a ≥4-fold increase compared with pre-vaccination titer in subjects with a pre-vaccination titer ≥10. (D) Geometric mean titer ratios (GMTRs). The GMTR was the ratio of post-vaccination HI titer vs. the pre-vaccination titer (day 0). Bars indicate means and error bars indicate 95% CI.

Figure 2. Salivary secreted IgA response to the ID and IM influenza vaccines Shown is the ratio of virus-specific to total IgA levels pre-vaccination (day 0) and 10, 14, 21, and 180 d post-vaccination. Bars represent geometric means and error bars indicate 95% CIs.
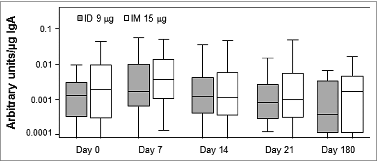
Figure 2. Salivary secreted IgA response to the ID and IM influenza vaccines Shown is the ratio of virus-specific to total IgA levels pre-vaccination (day 0) and 10, 14, 21, and 180 d post-vaccination. Bars represent geometric means and error bars indicate 95% CIs.

Figure 3. B cell responses to the ID and IM influenza vaccines (A) Number of circulating influenza virus-specific IgG-secreting cells pre-vaccination (day 0) and 7 d after vaccination. (B) Percent influenza virus-specific IgG-secreting memory B cells. PBMC were treated for 5 d as previously describedCitation37 to generate antibody-secreting B cells. Bars indicate geometric means and error bars indicate interquartile ranges.
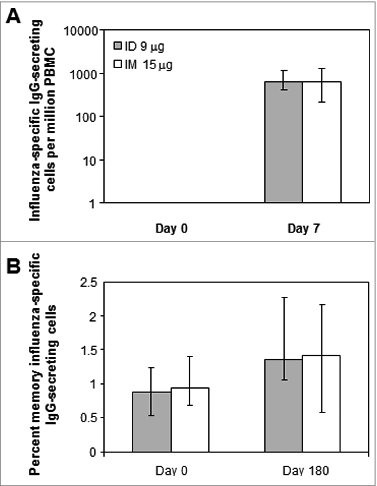
Figure 3. B cell responses to the ID and IM influenza vaccines (A) Number of circulating influenza virus-specific IgG-secreting cells pre-vaccination (day 0) and 7 d after vaccination. (B) Percent influenza virus-specific IgG-secreting memory B cells. PBMC were treated for 5 d as previously describedCitation37 to generate antibody-secreting B cells. Bars indicate geometric means and error bars indicate interquartile ranges.

Table 1. Cytokine release by PBMC in response to recombinant A/H1N1 Solomon Island hemagglutinin

Figure 4. Activated CD8+ T cells (CD3+CD8+CD69+) and T helper cells (CD3+CD8CD69+) in response to the ID and IM influenza vaccines Intracellular cytokine staining for CD3, CD8, CD69, IFN-γ, TNF-α, and IL-2 was performed in PBMC stimulated in vitro for 20–24 h with the indicated strains of influenza virus. Shown are the fractions of IFN-γ+, TNF-α+, and IL-2+ T-helper lymphocytes (CD3+CD8CD69+; left panel) and CD8+ T cells (CD3+CD8+CD69+; right panel). Bars indicate medians and error bars indicate interquartile ranges.
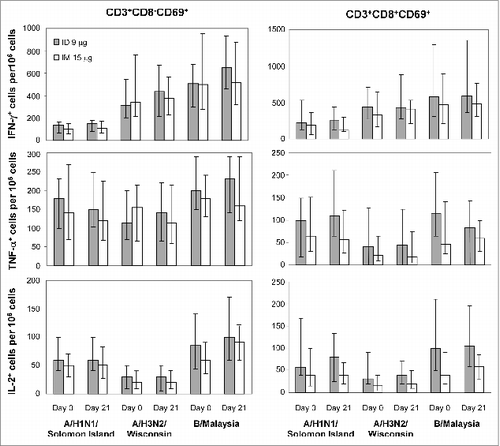
Figure 4. Activated CD8+ T cells (CD3+CD8+CD69+) and T helper cells (CD3+CD8−CD69+) in response to the ID and IM influenza vaccines Intracellular cytokine staining for CD3, CD8, CD69, IFN-γ, TNF-α, and IL-2 was performed in PBMC stimulated in vitro for 20–24 h with the indicated strains of influenza virus. Shown are the fractions of IFN-γ+, TNF-α+, and IL-2+ T-helper lymphocytes (CD3+CD8−CD69+; left panel) and CD8+ T cells (CD3+CD8+CD69+; right panel). Bars indicate medians and error bars indicate interquartile ranges.
Supplemental material

970921_Supplemental_Material.zip

Download Zip (45 KB)