1,255
Views
19
CrossRef citations to date
0
Altmetric
Research Paper

Moving a Carbohydrate Mimetic Peptide into the clinic

Clinical response of a breast cancer patient after mimotope-based immunotherapy

, , , , , , & show all
Pages 37-44 | Received 04 Aug 2014, Accepted 04 Aug 2014, Published online: 01 Nov 2014

Figures & data

Figure 1. IgM and IgG fractions of serum antibodies from immunized subject bind to MAP form of P10s in ELISA assays. ELISA plates were coated overnight and serum samples were diluted from 1:100 to 1:12 800. Reactivity was visualized using HRP-conjugated mouse anti-human antibody. Titers were estimated from absorbance- vs. -dilution curves by linear regression as described in the Methods section.
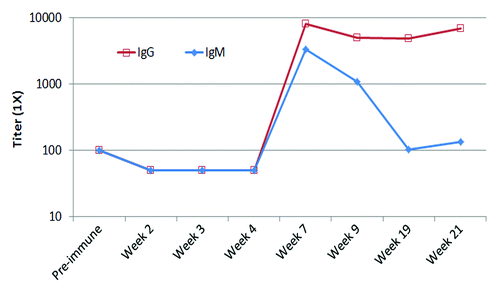
Figure 1. IgM and IgG fractions of serum antibodies from immunized subject bind to MAP form of P10s in ELISA assays. ELISA plates were coated overnight and serum samples were diluted from 1:100 to 1:12 800. Reactivity was visualized using HRP-conjugated mouse anti-human antibody. Titers were estimated from absorbance- vs. -dilution curves by linear regression as described in the Methods section.

Figure 2. P10s-induced IgG serum antibodies from immunized subject bind to HCC1954 and stimulate cell death. (A) Cells were harvested with enzyme-free buffer, washed and incubated with preimmune and postimmune (week 7) sera. Binding was visualized with an FITC-conjugated mouse anti-human IgG. Filled histogram, secondary antibody only; dashed line histogram, preimmune serum; solid line histogram, serum collected at week 7. 1:100 dilution of the serum was used for reactivity. (B) P10s immunized serum kills HCC1954 breast cancer cells in vitro. Error bars represent SD based on three replications. The experiment was repeated three times. Two-tailed Student t test was used for comparison of means.
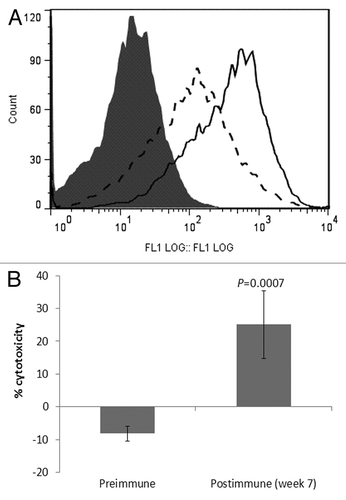
Figure 2. P10s-induced IgG serum antibodies from immunized subject bind to HCC1954 and stimulate cell death. (A) Cells were harvested with enzyme-free buffer, washed and incubated with preimmune and postimmune (week 7) sera. Binding was visualized with an FITC-conjugated mouse anti-human IgG. Filled histogram, secondary antibody only; dashed line histogram, preimmune serum; solid line histogram, serum collected at week 7. 1:100 dilution of the serum was used for reactivity. (B) P10s immunized serum kills HCC1954 breast cancer cells in vitro. Error bars represent SD based on three replications. The experiment was repeated three times. Two-tailed Student t test was used for comparison of means.

Figure 3. Anti-P10s serum from immunized subject inhibited migration of HCC1954 cells. Cells were incubated overnight with FBS or indicated sera on transwell membranes. Membranes were fixed, stained and those cells left on the surface were wiped out. Migrated cells were then visualized under a light microscope and counted. Average over three replications with SD are shown. P values were estimated by performing one-way ANOVA with Post-hoc Tukey analysis. N.S., not significant.
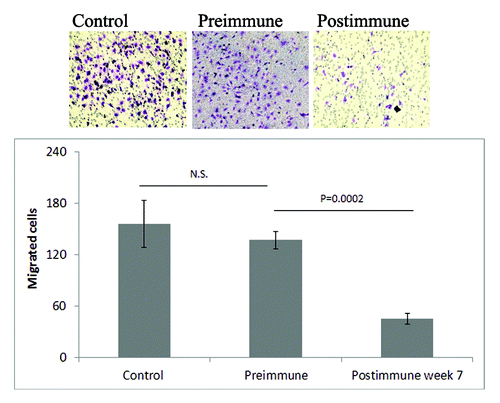
Figure 3. Anti-P10s serum from immunized subject inhibited migration of HCC1954 cells. Cells were incubated overnight with FBS or indicated sera on transwell membranes. Membranes were fixed, stained and those cells left on the surface were wiped out. Migrated cells were then visualized under a light microscope and counted. Average over three replications with SD are shown. P values were estimated by performing one-way ANOVA with Post-hoc Tukey analysis. N.S., not significant.

Figure 4. Postimmunization plasma kills breast cancer cells. (A) Cytotoxic effect of pre and postimmunization plasma (week 7) on HCC1954 and MDA-MB-231 cells. 5 × 10⁴ were seeded in 24-well plates and incubated with the sera. Supernatants containing dead cells were removed and live cells were fixed and stained and images were taken. Representative images are shown. (B) Cytotoxicity in each cell line was also quantified by counting cells remained in triplicate wells and presented by bar graph. For each well 3 microscopic fields were counted and averaged. Percent toxicity was calculated based on cell number in control wells. P values are the result of comparing the effects of pre and postimmune sera on each cell line by two-tailed t tests.
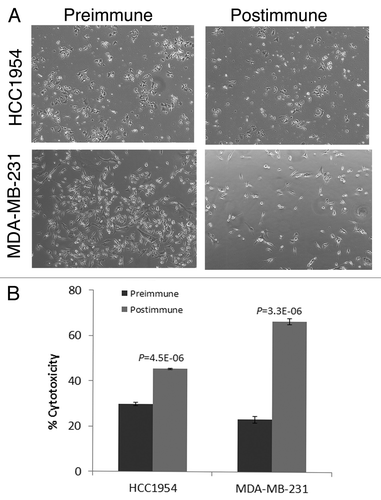
Figure 4. Postimmunization plasma kills breast cancer cells. (A) Cytotoxic effect of pre and postimmunization plasma (week 7) on HCC1954 and MDA-MB-231 cells. 5 × 10⁴ were seeded in 24-well plates and incubated with the sera. Supernatants containing dead cells were removed and live cells were fixed and stained and images were taken. Representative images are shown. (B) Cytotoxicity in each cell line was also quantified by counting cells remained in triplicate wells and presented by bar graph. For each well 3 microscopic fields were counted and averaged. Percent toxicity was calculated based on cell number in control wells. P values are the result of comparing the effects of pre and postimmune sera on each cell line by two-tailed t tests.

Figure 5. Anti-P10s serum induced apoptosis in MDA-MB-231 cells. Cells were incubated with 10% FBS (control) or indicated sera overnight and then harvested and stained with annexin V-FITC (FL1) and propidium iodide (FL3) using a live/dead assay kit from Invitrogen (Life Technologies, Grand Island, NY). U4, P4, and Q4 show apoptotic cells in control, preimmune treated and postimmune treated cells, respectively.

Figure 5. Anti-P10s serum induced apoptosis in MDA-MB-231 cells. Cells were incubated with 10% FBS (control) or indicated sera overnight and then harvested and stained with annexin V-FITC (FL1) and propidium iodide (FL3) using a live/dead assay kit from Invitrogen (Life Technologies, Grand Island, NY). U4, P4, and Q4 show apoptotic cells in control, preimmune treated and postimmune treated cells, respectively.

Figure 6. Preincubation with subject’s serum sensitized tumor cells to docetaxel toxicity. MDA-MB-231 cells were cultured in RPMI medium containing 10% FBS overnight. Medium was then replaced with one that contained pre or postimmune sera. FBS was used as control. After 5 h of incubation docetaxel was added in serial dilutions into wells. Twenty-four hours later wells were washed and live cells were fixed, stained and counted. Cell survival was determined and IC50 were estimated. Postimmune IC50 is significantly different that FBS and Preimmune IC50s, with P values of 6.21E-08 and 0.002, respectively.
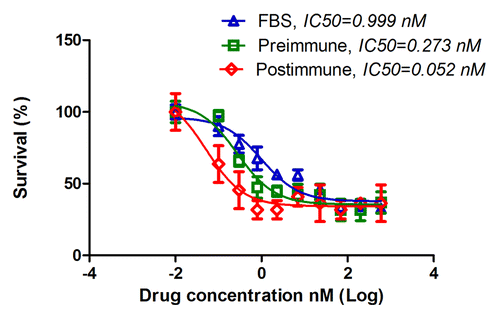
Figure 6. Preincubation with subject’s serum sensitized tumor cells to docetaxel toxicity. MDA-MB-231 cells were cultured in RPMI medium containing 10% FBS overnight. Medium was then replaced with one that contained pre or postimmune sera. FBS was used as control. After 5 h of incubation docetaxel was added in serial dilutions into wells. Twenty-four hours later wells were washed and live cells were fixed, stained and counted. Cell survival was determined and IC50 were estimated. Postimmune IC50 is significantly different that FBS and Preimmune IC50s, with P values of 6.21E-08 and 0.002, respectively.

Figure 7. Baseline PET scan shows two small lesions in the lower lobe of the right lung (A). The lesions FDG uptake on PET scan that was done 7 wk into the beginning of vaccination (B). PET scan six months later (C) showed return to baseline with no new lesions elsewhere.
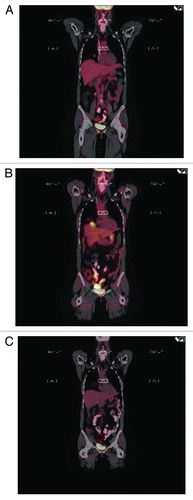
Figure 7. Baseline PET scan shows two small lesions in the lower lobe of the right lung (A). The lesions FDG uptake on PET scan that was done 7 wk into the beginning of vaccination (B). PET scan six months later (C) showed return to baseline with no new lesions elsewhere.

Figure 8. MRI of the brain done on 5/11/2012. Cystic lesions were seen in the cerebellum (A), temporal (B), and frontal (C) lobes. Resection of the two large lesions showed no viable tumor on pathology specimens. PET scan done around the same time showed return of the lung lesions to baseline suggesting maximal response in the lung and possibly in the brain, which might explain the absence of viable tumor on pathology.

Figure 8. MRI of the brain done on 5/11/2012. Cystic lesions were seen in the cerebellum (A), temporal (B), and frontal (C) lobes. Resection of the two large lesions showed no viable tumor on pathology specimens. PET scan done around the same time showed return of the lung lesions to baseline suggesting maximal response in the lung and possibly in the brain, which might explain the absence of viable tumor on pathology.

Reprints and Corporate Permissions

Please note: Selecting permissions does not provide access to the full text of the article, please see our help page How do I view content?

To request a reprint or corporate permissions for this article, please click on the relevant link below:

Academic Permissions

Please note: Selecting permissions does not provide access to the full text of the article, please see our help page How do I view content?

Obtain permissions instantly via Rightslink by clicking on the button below:

If you are unable to obtain permissions via Rightslink, please complete and submit this Permissions form. For more information, please visit our Permissions help page.