2,670
Views
59
CrossRef citations to date
0
Altmetric
Report

New methods allowing the detection of protein aggregates

A case study on trastuzumab

, , , &
Pages 142-150 | Received 03 Nov 2008, Accepted 11 Dec 2008, Published online: 01 Mar 2009

Figures & data

Figure 1 Trastuzumab diluted in 0.9% NaCl (A) and in 5% dextrose (B) analysed by FFF. Trastuzumab concentration was 1.28 mg/ml and the analysis was performed with 0.9% NaCl as the running buffer (carrier liquid). Separation started at 5 minutes elution time and stopped at 14 minutes elution time. Molecular weights (thick lines, left scale) are superimposed on the UV signals (thin lines, right scale). The monomer peak at 11.5 minutes shows a molecular weight of 160 kDa. The inset provides a magnified view of the chromatograms, showing a second peak at 13 minutes that can be interpreted as small aggregates. With the method used, no differences can be seen between trastuzumab diluted in NaCl and diluted in dextrose.
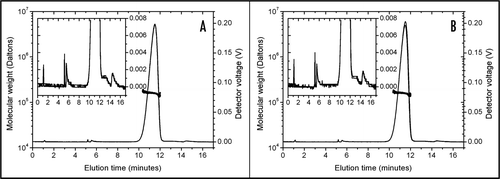
Figure 1 Trastuzumab diluted in 0.9% NaCl (A) and in 5% dextrose (B) analysed by FFF. Trastuzumab concentration was 1.28 mg/ml and the analysis was performed with 0.9% NaCl as the running buffer (carrier liquid). Separation started at 5 minutes elution time and stopped at 14 minutes elution time. Molecular weights (thick lines, left scale) are superimposed on the UV signals (thin lines, right scale). The monomer peak at 11.5 minutes shows a molecular weight of 160 kDa. The inset provides a magnified view of the chromatograms, showing a second peak at 13 minutes that can be interpreted as small aggregates. With the method used, no differences can be seen between trastuzumab diluted in NaCl and diluted in dextrose.

Figure 2 FFF analysis of trastuzumab diluted in 0.9% NaCl (A and C) and in 5% dextrose (B and D). Molecular weights (dots, left scale) are superimposed on the UV signals (lines, right scale). Each colour indicates a separate injection. No focussing or cross-flow was applied. After 1 minute elution time, trastuzumab solutions (1.28 mg/ml) were injected in the channel flow. (A) Trastuzumab diluted in 0.9% NaCl and analysed with 0.9% NaCl as the running buffer. Between 2.5 and 3.5 minutes, only the monomeric protein could be seen. (B) Trastuzumab diluted in 5% dextrose and analysed with 5% dextrose as the running buffer. Recovery was low and variable as shown by the UV signal: part of the sample was adsorbed to the FFF system. Baselines did not come back to zero. Molecular weight determination indicated the presence of large species. (C) Trastuzumab diluted in 0.9% NaCl and analysed with 5% dextrose as the running buffer. Upon contact with 5% dextrose in the FFF channel, trastuzumab immediately aggregated, as indicated by the higher molecular weight, the low and variable recovery and the baselines not coming back to zero. (D) Trastuzumab diluted in 5% dextrose and analysed with 0.9% NaCl as the running buffer. Trastuzumab aggregates (as seen in (C)) were partially disrupted during analysis in 0.9% NaCl. Only the increased molecular weight (between 2.5 and 3.5 minutes) indicated the presence of aggregates.
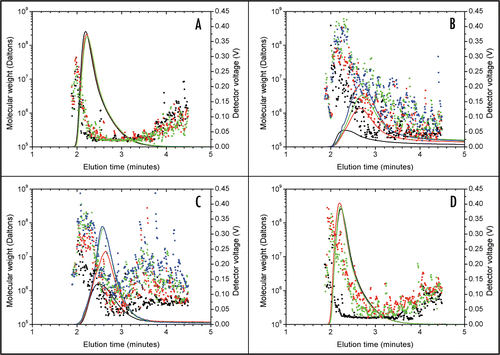
Figure 2 FFF analysis of trastuzumab diluted in 0.9% NaCl (A and C) and in 5% dextrose (B and D). Molecular weights (dots, left scale) are superimposed on the UV signals (lines, right scale). Each colour indicates a separate injection. No focussing or cross-flow was applied. After 1 minute elution time, trastuzumab solutions (1.28 mg/ml) were injected in the channel flow. (A) Trastuzumab diluted in 0.9% NaCl and analysed with 0.9% NaCl as the running buffer. Between 2.5 and 3.5 minutes, only the monomeric protein could be seen. (B) Trastuzumab diluted in 5% dextrose and analysed with 5% dextrose as the running buffer. Recovery was low and variable as shown by the UV signal: part of the sample was adsorbed to the FFF system. Baselines did not come back to zero. Molecular weight determination indicated the presence of large species. (C) Trastuzumab diluted in 0.9% NaCl and analysed with 5% dextrose as the running buffer. Upon contact with 5% dextrose in the FFF channel, trastuzumab immediately aggregated, as indicated by the higher molecular weight, the low and variable recovery and the baselines not coming back to zero. (D) Trastuzumab diluted in 5% dextrose and analysed with 0.9% NaCl as the running buffer. Trastuzumab aggregates (as seen in (C)) were partially disrupted during analysis in 0.9% NaCl. Only the increased molecular weight (between 2.5 and 3.5 minutes) indicated the presence of aggregates.

Figure 3 Rinsing of the FFF channel after several injections of trastuzumab in 5% dextrose. Molecular weights (dots, left scale) are superimposed on the UV signal (line, right scale). A thorough rinsing of the channel detached high molecular weight trastuzumab aggregates that were adsorbed on the FFF system.
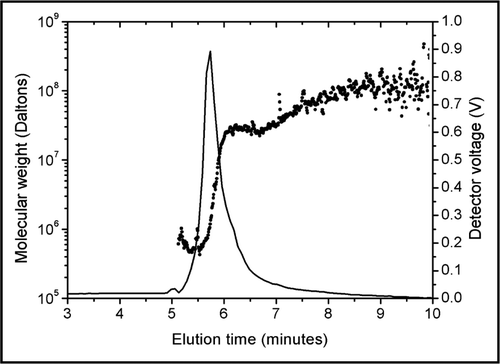
Figure 3 Rinsing of the FFF channel after several injections of trastuzumab in 5% dextrose. Molecular weights (dots, left scale) are superimposed on the UV signal (line, right scale). A thorough rinsing of the channel detached high molecular weight trastuzumab aggregates that were adsorbed on the FFF system.

Figure 4 Steady-state fluorescence emission spectra of 50 µM ANS in the presence of NaCl-diluted trastuzumab (solid line) and dextrose-diluted trastuzumab (dotted line). When trastuzumab was diluted in 5% dextrose, ANS exhibited a higher fluorescence as well as a shift to smaller wavelengths, indicative of a stronger binding of ANS to dextrose-diluted trastuzumab than to NaCl-diluted trastuzumab.
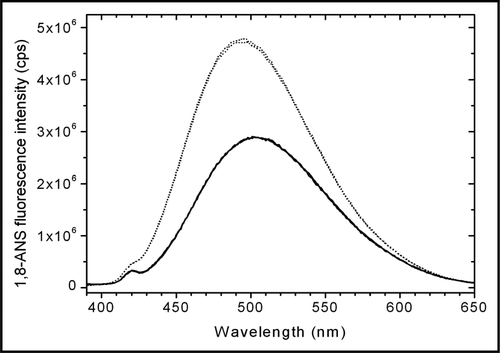
Figure 4 Steady-state fluorescence emission spectra of 50 µM ANS in the presence of NaCl-diluted trastuzumab (solid line) and dextrose-diluted trastuzumab (dotted line). When trastuzumab was diluted in 5% dextrose, ANS exhibited a higher fluorescence as well as a shift to smaller wavelengths, indicative of a stronger binding of ANS to dextrose-diluted trastuzumab than to NaCl-diluted trastuzumab.

Figure 5 Steady-state fluorescence anisotropy spectra of 50 µM ANS in the presence of NaCl-diluted trastuzumab (solid line) and dextrose-diluted trastuzumab (dotted line). The higher anisotropy of ANS in dextrose-diluted trastuzumab is indicative of a lower mobility of ANS, consecutive to a stronger binding to trastuzumab.
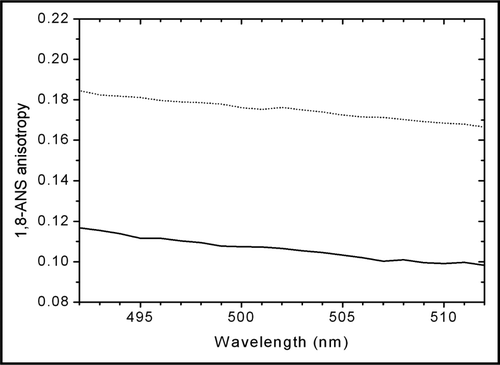
Figure 5 Steady-state fluorescence anisotropy spectra of 50 µM ANS in the presence of NaCl-diluted trastuzumab (solid line) and dextrose-diluted trastuzumab (dotted line). The higher anisotropy of ANS in dextrose-diluted trastuzumab is indicative of a lower mobility of ANS, consecutive to a stronger binding to trastuzumab.

Figure 6 Fluorescence photomicrographs of trastuzumab diluted in 0.9% NaCl (A) and in 5% dextrose (B). Aggregates are designated with arrows. (A) In 0.9% NaCl, trastuzumab aggregates were small (<10 µm). (B) In 5% dextrose, trastuzumab aggregates were larger (most aggregates >10 µm) and present in higher numbers.
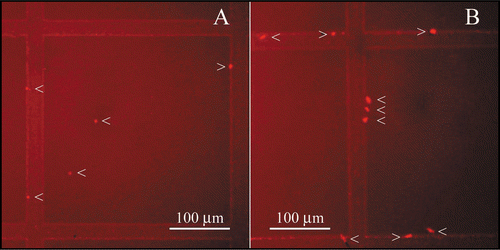
Figure 6 Fluorescence photomicrographs of trastuzumab diluted in 0.9% NaCl (A) and in 5% dextrose (B). Aggregates are designated with arrows. (A) In 0.9% NaCl, trastuzumab aggregates were small (<10 µm). (B) In 5% dextrose, trastuzumab aggregates were larger (most aggregates >10 µm) and present in higher numbers.

Figure 7 Transmission electron microscopy images of trastuzumab solutions (1.28 mg/ml) in 0.9% NaCl; low magnification, (A); high magnification, (C) and in 5% dextrose, low magnification, (B); high magnification, (D) Aggregates were only present in 5% dextrose and appeared as black spots (B and D).
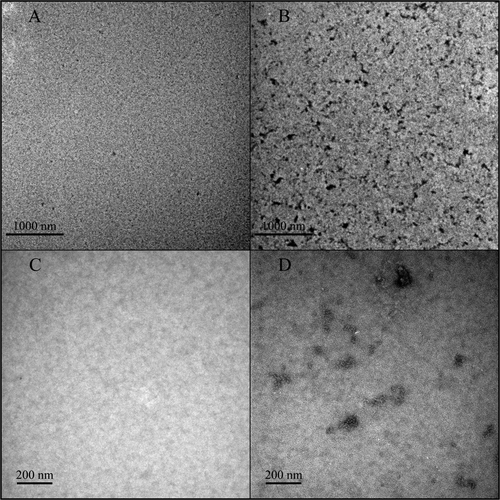
Figure 7 Transmission electron microscopy images of trastuzumab solutions (1.28 mg/ml) in 0.9% NaCl; low magnification, (A); high magnification, (C) and in 5% dextrose, low magnification, (B); high magnification, (D) Aggregates were only present in 5% dextrose and appeared as black spots (B and D).

Figure 8 Transmission electron microscopy image of a trastuzumab aggregate formed in 5% dextrose. The aggregate appears amorphous, without fibrillar structure.
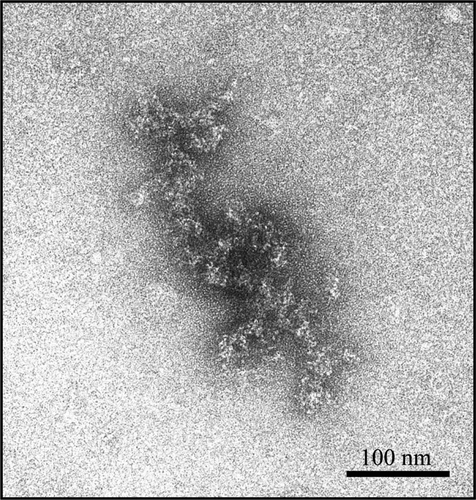
Figure 8 Transmission electron microscopy image of a trastuzumab aggregate formed in 5% dextrose. The aggregate appears amorphous, without fibrillar structure.

Figure 9 Transmission electron microscopy images of 0.9% NaCl (A) and 5% dextrose (B) solutions, without trastuzumab. No particles are visible.
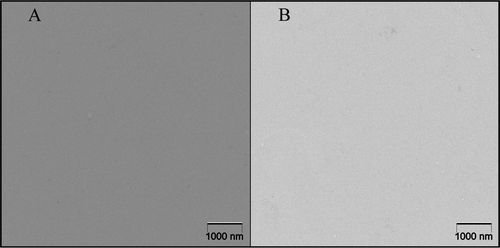
Figure 9 Transmission electron microscopy images of 0.9% NaCl (A) and 5% dextrose (B) solutions, without trastuzumab. No particles are visible.

Table 1 Field-flow fractionation methods used for the characterization of trastuzumab samples

Table 2 ANS fluorescence lifetime parameters for trastuzumab diluted in: (A) 0.9% NaCl and (B) 5% dextrose

Table 3 Comparative table of the analytical techniques presented in this paper

Reprints and Corporate Permissions

Please note: Selecting permissions does not provide access to the full text of the article, please see our help page How do I view content?

To request a reprint or corporate permissions for this article, please click on the relevant link below:

Academic Permissions

Please note: Selecting permissions does not provide access to the full text of the article, please see our help page How do I view content?

Obtain permissions instantly via Rightslink by clicking on the button below:

If you are unable to obtain permissions via Rightslink, please complete and submit this Permissions form. For more information, please visit our Permissions help page.