Figures & data
Figure 1 Expression vectors expressing the SM-6 (J+) and SM-6 (J−) IgM. The heavy chain (HC), light chain (LC) and J chain are all expressed from the hCMV promoter.
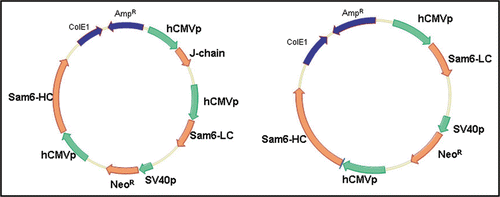
Figure 2 Summary of PER.C6® cell line generation. The expression construct is introduced into serum-free and suspension adapted PER.C6® cells by electroporation. Following a short recovery period, cells are seeded into 96-well plates by limiting dilution, whereupon stable transfectants are selected by survival in the presence of the antibiotic Geneticin®. Following productivity screens in the multi-well plates, candidate cell lines are expanded and cultured in shake flasks. Batch and fed-batch assays were performed on the candidate cell lines to determine Qpmax and volumetric productivity.

Figure 3 Productivity of IgG and IgM expressing cell lines in PER.C6® cells, in a 7-day batch process. The average Qpmax values for the top 4 cell lines, for 6 independent IgG stable cell line generation programs, are shown in the red bar (n = 24). For the SM-6 (J−) and SM-6 (J+) IgMs, the average of the top 4 cell lines for each variant is shown in the blue bars. For each variant, the Qpmax for the leading cell line is indicated by the yellow circle.
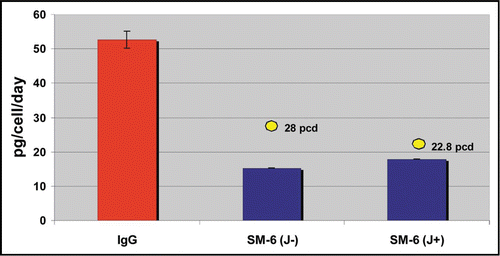
Figure 4 Cell growth profiles from a small scale fed-batch screen of 21 candidate LM-1 IgM expressing cell lines (A) and 22 candidate CM-1 IgM expressing cell lines (B). Colored traces represent results from individual clones.
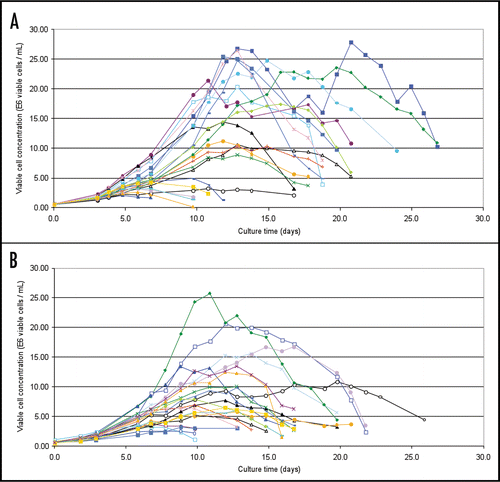
Figure 5 Production profiles from a small scale fed-batch screen of 21 candidate LM-1 IgM expressing cell lines (A) and 22 candidate CM-1 IgM expressing cell lines (B). Colored traces represent results from individual clones.
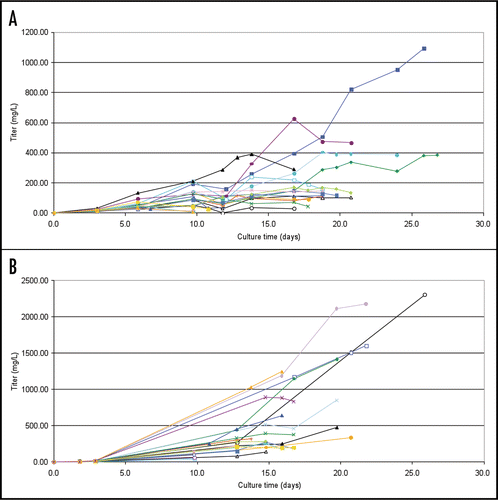
Figure 6 Evaluation of pentameric/hexameric expression of IgM in PER.C6® cells. Samples were run on 3.7% polyacrylamide-agarose composite SDS-PAGE gel and subjected to western blotting analysis. Ten micrograms of purified IgM was loaded for each recombinant IgM. Lane 1: CM-1 clone 064 (J+); Lane 2: LM-1 clone 041 (J+); Lane 3: XP control (J chain positive); Lane 4: GP control (J chain deficient); Lane 5: XP control (J chain positive); Lane 6: GP control (J chain deficient); Lane 7: SM-6 clone 089 (J−); Lane 8: SM-6 clone 130 (J−); Lane 9: SM-6 clone 450 (J+); Lane 10: SM-6 clone 528 (J+). Control IgMs were described by Collins et al.Citation3
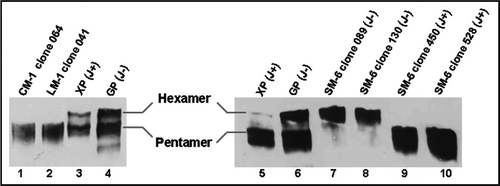
Figure 7 FACS analysis of hybridoma and PER.C6® derived IgM antibodies on tumor cells. Top: FACS analysis of SM-6 antibody binding to tumor cell line BXPC-3. Positive control SM-6 antibody (black line, 100 µg/mL) is hybridoma produced IgM. CP IgM (Chrompure; red line 100 µg/mL) was used as a negative control. PER.C6® SM-6 (J−) clones 089 and 130, and SM-6 (J+) clones 450 and 528 were tested (black line, 100 µg/mL). Middle: FACS analysis of LM-1 antibody binding to the BXPC-3 cell line. Positive control LM-1 (black line, 100 µg/mL) is hybridoma produced IgM. Negative control is CP IgM (Chrompure; red line 100 µg/mL). PER.C6® LM-1 clones 041 and 170 were tested (black line, 100 µg/mL). Bottom: FACS analysis of CM-1 antibody to the tumor cell line A549. Positive control CM-1 (black line, 100 µg/mL) is hybridoma produced IgM. Negative control is CP IgM (Chrompure; red line 100 µg/mL). PER.C6® CM-1 clones 027 and 064 were tested (100 µg/mL).
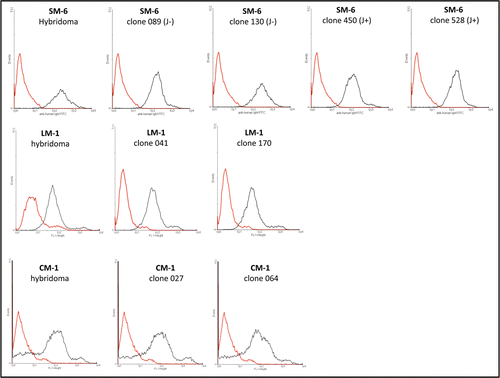
Figure 8 Calcein-AM assay with purified PER.C6® derived IgM antibodies. HeLa cells were seeded into 96-well plates and incubated with increasing amounts of antibodies or formulation buffer alone. Cell viability was measured after incubation for 2 hours with Calcein-AM. The percentage cytotoxicity was calculated using the following formula: Cytotoxicity [%] = [100/(cellsonly × cells+formulation buffer)] − [100/(cellsonly × cells+antibody)], where cellsonly are cells in RPMI medium without formulation buffer or antibody. Dose-dependent increase in cytotoxicity was observed with LM-1 IgM (A) and SM-6 IgM (B) antibodies incubated with HeLa tumor cells.
![Figure 8 Calcein-AM assay with purified PER.C6® derived IgM antibodies. HeLa cells were seeded into 96-well plates and incubated with increasing amounts of antibodies or formulation buffer alone. Cell viability was measured after incubation for 2 hours with Calcein-AM. The percentage cytotoxicity was calculated using the following formula: Cytotoxicity [%] = [100/(cellsonly × cells+formulation buffer)] − [100/(cellsonly × cells+antibody)], where cellsonly are cells in RPMI medium without formulation buffer or antibody. Dose-dependent increase in cytotoxicity was observed with LM-1 IgM (A) and SM-6 IgM (B) antibodies incubated with HeLa tumor cells.](/cms/asset/bb873658-7976-448f-a540-e40a40b6be56/kmab_a_10907945_f0008.gif)
Table 1 Productivities of lead clones for each of the four IgM variants in a fed-batch process