12,413
Views
327
CrossRef citations to date
0
Altmetric
Report

Charge variants in IgG1

Isolation, characterization, in vitro binding properties and pharmacokinetics in rats

, , , , , , , , , , , , , , , , & show all
Pages 613-624 | Received 27 Aug 2010, Accepted 15 Aug 2010, Published online: 01 Nov 2010

Figures & data

Figure 1 Chromatographic profiles obtained from a (A) IEC shown in full scale and (B) SEC shown in expanded scale for all charge variant fractions, starting material and buffer blanks. See for numerical values obtained from these analyses.
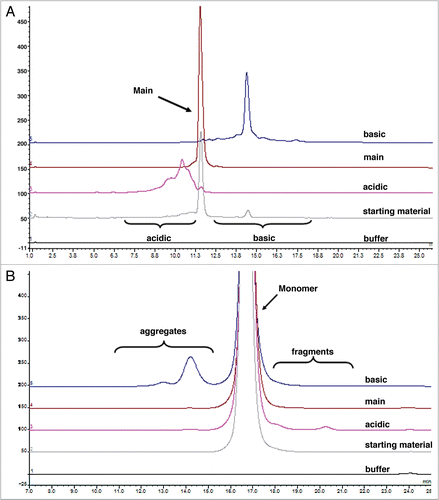
Figure 1 Chromatographic profiles obtained from a (A) IEC shown in full scale and (B) SEC shown in expanded scale for all charge variant fractions, starting material and buffer blanks. See Table 2 for numerical values obtained from these analyses.

Figure 2 Representative sensorgrams of fitted data from the kinetic analysis of all charge variant fractions (A) acidic, (B) main, (C) basic and (D) starting material to immobilized rat FcRn. Black lines are fitted curves using a bivalent binding model. All sample concentrations (from bottom to top) are 62.5, 125, 250, 500, 1,000, 2,000 and 4,000 nM. Residual plot shows the difference between experimental and fitted data for every point in the sensorgram. Also see for clarity.
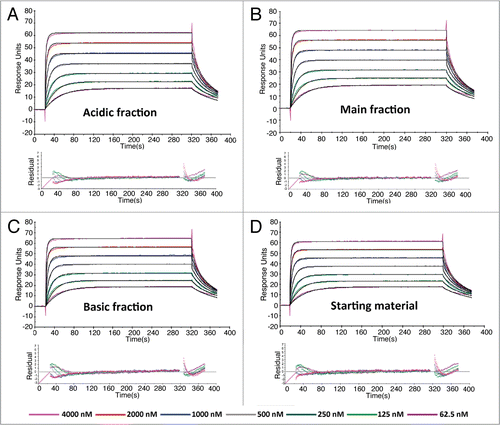
Figure 2 Representative sensorgrams of fitted data from the kinetic analysis of all charge variant fractions (A) acidic, (B) main, (C) basic and (D) starting material to immobilized rat FcRn. Black lines are fitted curves using a bivalent binding model. All sample concentrations (from bottom to top) are 62.5, 125, 250, 500, 1,000, 2,000 and 4,000 nM. Residual plot shows the difference between experimental and fitted data for every point in the sensorgram. Also see Table 4 for clarity.

Figure 3 Linear changes in serum concentrations versus time for all charge variant fractions following single (A) intraveneous or (B) subcutaneous administration of 10 mg/kg in normal rats. The assay minimum quantifiable concentration was 0.4 µg/mL in rat serum. Results are mean ± SD (n = 12 rats/time point).
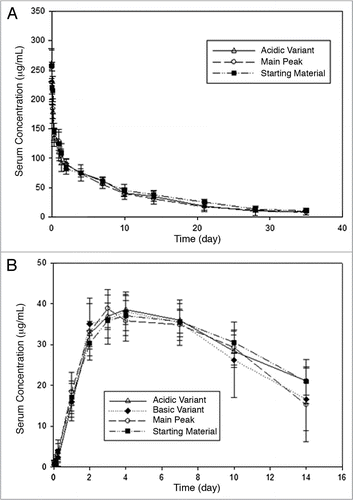
Figure 3 Linear changes in serum concentrations versus time for all charge variant fractions following single (A) intraveneous or (B) subcutaneous administration of 10 mg/kg in normal rats. The assay minimum quantifiable concentration was 0.4 µg/mL in rat serum. Results are mean ± SD (n = 12 rats/time point).

Table 1 Major chemical degradation pathways which are a common source of charge-related heterogeneity of therapeutic IgG1 mAbs

Table 2 Analytical results to assess all mAb charge variant fractions

Table 3 Analytical characterization of isolated charge variant fractions

Table 4 Comparison of all charge variant fractions to evaluate their kinetics of binding to rat FcRn, binding responses (in response unit) and their in vitro binding specific activity

Table 5 Pharmacokinetic parameters of all mAb fractions in normal rats

Reprints and Corporate Permissions

Please note: Selecting permissions does not provide access to the full text of the article, please see our help page How do I view content?

To request a reprint or corporate permissions for this article, please click on the relevant link below:

Academic Permissions

Please note: Selecting permissions does not provide access to the full text of the article, please see our help page How do I view content?

Obtain permissions instantly via Rightslink by clicking on the button below:

If you are unable to obtain permissions via Rightslink, please complete and submit this Permissions form. For more information, please visit our Permissions help page.