1,369
Views
10
CrossRef citations to date
0
Altmetric
Report

An automated immunoassay for early specificity profiling of antibodies

, , , &
Pages 279-287 | Received 19 Dec 2012, Accepted 08 Jan 2013, Published online: 14 Feb 2013

Figures & data

Figure 1. Flow scheme (A) and microtiter plate layout (B) of the 3P assay. A shows flow scheme of the 3P assay. Incubation times are given in parentheses. B shows the microtiter plate layout of the 3P assay. Proteins as indicated in the figure are immobilized in rows (wells 1–24) on two 384-well MSD plates. Rows B and P on plate 1 and row O on plate 2 are variable positions, e.g., for antibody target and counter targets. Rows J–O on plate 1 contain cytokines and cell surface receptors. Samples are dispensed in columns on both 384-well plates: Columns 1 and 2 are used for two blank controls or one blank control and a system suitability test (SST), respectively. Up to 10 samples to be analyzed for binding specificity are dispensed to columns 3–22 at each 100 nM and 10 nM concentration, respectively. Columns 23 and 24 are used for the reference monoclonal antibody (MOR ref. mAb, anti lysozyme) at 100 nM and 10 nM, respectively.
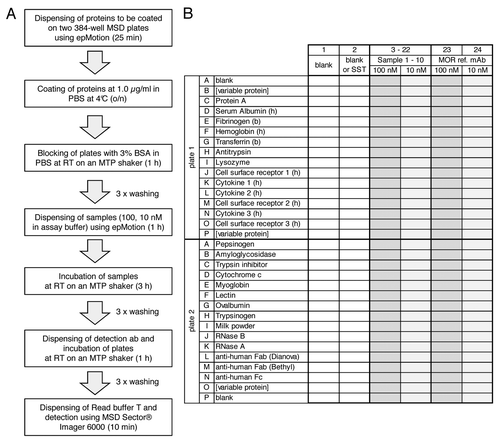
Figure 1. Flow scheme (A) and microtiter plate layout (B) of the 3P assay. A shows flow scheme of the 3P assay. Incubation times are given in parentheses. B shows the microtiter plate layout of the 3P assay. Proteins as indicated in the figure are immobilized in rows (wells 1–24) on two 384-well MSD plates. Rows B and P on plate 1 and row O on plate 2 are variable positions, e.g., for antibody target and counter targets. Rows J–O on plate 1 contain cytokines and cell surface receptors. Samples are dispensed in columns on both 384-well plates: Columns 1 and 2 are used for two blank controls or one blank control and a system suitability test (SST), respectively. Up to 10 samples to be analyzed for binding specificity are dispensed to columns 3–22 at each 100 nM and 10 nM concentration, respectively. Columns 23 and 24 are used for the reference monoclonal antibody (MOR ref. mAb, anti lysozyme) at 100 nM and 10 nM, respectively.

Figure 2.3P analysis of four marketed therapeutic monoclonal IgG molecules and one IgG with trastuzumab VH and VL regions and HuCAL® constant regions (MOR mAb R20). Raw ECL signals for background binding of the ECL-labeled detection antibody to coated proteins (as indicated on the left) are shown in columns 1 and 2 (blank). Raw ECL signals for binding of reference antibody (MOR ref. mAb) at 100 nM and 10 nM are shown in columns 23 and 24, respectively. Commercial therapeutic and tool antibodies rituximab, bevacizumab, ustekinumab, MOR mAb R20 (see Materials and Methods and Results), and adalimumab were tested at 100 nM and 10 nM in duplicates (see left and right part of figure). Numbers in columns 3–22 indicate x-fold binding (rounded numbers) of analyzed sample to respective coated protein over binding of the MOR ref. mAb to the same coated protein at the same concentration analyzed, e.g., 1,093 (see plate 1, well B9) indicates that ECL signal for binding of 100 nM MOR mAb R20 to coated human ErbB2 (trastuzumab target) was 1,093-fold increased over binding of 100 nM MOR ref. mAb to coated human ErbB2. As expected, ustekinumab bound to its target IL23 (see plate 2, wells O7, 8, 17, 18). A binding ratio of 0 always indicates that the sample binds weaker to the immobilized protein than the MOR ref. mAb. Colored shadings in columns 3–22 visualize degree of x-fold binding over reference antibody: green represents a binding ratio of up to 5; yellow is up to 10; red is above 50. Blue shading indicates binding to target proteins. Note, only the target proteins for ustekinumab and MOR mAb R20 (IL23 and ErbB2) were included here. The cumulative binding ratio (CBR) for each concentration, 100 nM and 10 nM, respectively, and the sum of these CBRs are given at the two bottom lines. Colored shadings of sum of CBRs is as follows: up to 150 green (i.e., overall no/low degree of unspecific binding); up to 250 yellow (overall moderate degree of unspecific binding); above 400 red (overall high degree of unspecific binding). Note that the anti-human Fab detection antibody (goat) shows cross-reactivity to coated Protein A (plate 1, wells C1, 2); however, since the binding signals for IgG molecules to Protein A are much larger (plate 1, wells C23, 24) and this coated protein serves as a positive control, the observed cross-reactivity was regarded to be acceptable. The same is true for binding of the detection antibody to coated anti-human antibodies (plate 2, rows L, M, N). As expected, the MOR ref. mAb strongly interacts with its target lysozyme (plate 1, wells I23, 24).
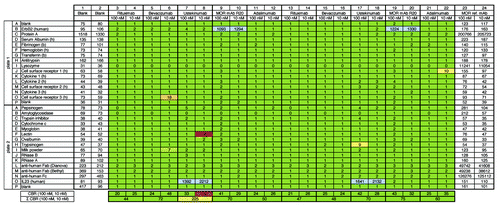
Figure 2.3P analysis of four marketed therapeutic monoclonal IgG molecules and one IgG with trastuzumab VH and VL regions and HuCAL® constant regions (MOR mAb R20). Raw ECL signals for background binding of the ECL-labeled detection antibody to coated proteins (as indicated on the left) are shown in columns 1 and 2 (blank). Raw ECL signals for binding of reference antibody (MOR ref. mAb) at 100 nM and 10 nM are shown in columns 23 and 24, respectively. Commercial therapeutic and tool antibodies rituximab, bevacizumab, ustekinumab, MOR mAb R20 (see Materials and Methods and Results), and adalimumab were tested at 100 nM and 10 nM in duplicates (see left and right part of figure). Numbers in columns 3–22 indicate x-fold binding (rounded numbers) of analyzed sample to respective coated protein over binding of the MOR ref. mAb to the same coated protein at the same concentration analyzed, e.g., 1,093 (see plate 1, well B9) indicates that ECL signal for binding of 100 nM MOR mAb R20 to coated human ErbB2 (trastuzumab target) was 1,093-fold increased over binding of 100 nM MOR ref. mAb to coated human ErbB2. As expected, ustekinumab bound to its target IL23 (see plate 2, wells O7, 8, 17, 18). A binding ratio of 0 always indicates that the sample binds weaker to the immobilized protein than the MOR ref. mAb. Colored shadings in columns 3–22 visualize degree of x-fold binding over reference antibody: green represents a binding ratio of up to 5; yellow is up to 10; red is above 50. Blue shading indicates binding to target proteins. Note, only the target proteins for ustekinumab and MOR mAb R20 (IL23 and ErbB2) were included here. The cumulative binding ratio (CBR) for each concentration, 100 nM and 10 nM, respectively, and the sum of these CBRs are given at the two bottom lines. Colored shadings of sum of CBRs is as follows: up to 150 green (i.e., overall no/low degree of unspecific binding); up to 250 yellow (overall moderate degree of unspecific binding); above 400 red (overall high degree of unspecific binding). Note that the anti-human Fab detection antibody (goat) shows cross-reactivity to coated Protein A (plate 1, wells C1, 2); however, since the binding signals for IgG molecules to Protein A are much larger (plate 1, wells C23, 24) and this coated protein serves as a positive control, the observed cross-reactivity was regarded to be acceptable. The same is true for binding of the detection antibody to coated anti-human antibodies (plate 2, rows L, M, N). As expected, the MOR ref. mAb strongly interacts with its target lysozyme (plate 1, wells I23, 24).

Figure 3.3P analysis of four HuCAL® derived IgG molecules (targeted against a cell surface receptor: plate 1, row M) and correlation with data from Protagen using the UNIchip®. Figure shows results from 3P analysis of four HuCAL® derived IgG molecules that were previously analyzed by Protagen using the UNIchip® on a fee-for-service basis. Results shown as OTA from Protagen’s analysis are indicated below the 3P results. In 3P, as expected, strong binding to the target (cell surface receptor 2) was observed for all antibodies. For two IgGs, MOR mAb A1 and A2, no unspecific binding was observed (see Σ CBR = 125 and 161, green shaded). The degree of unspecific binding of MOR mAb A3 and mAB A4 was ranked with moderate to high (Σ CBR = 394, light red shaded) and moderate (Σ CBR = 250, yellow shaded), respectively. Overall, the 3P and Protagen UNIchip® results are in good qualitative agreement.
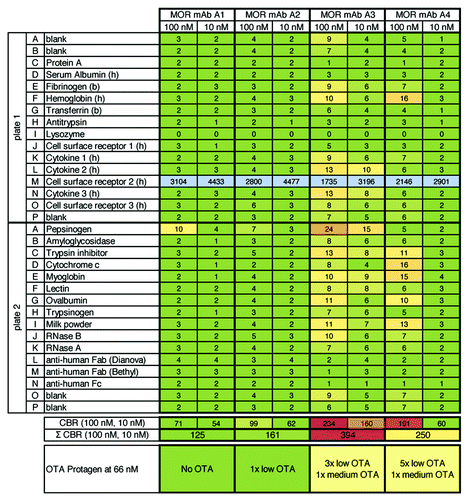
Figure 3.3P analysis of four HuCAL® derived IgG molecules (targeted against a cell surface receptor: plate 1, row M) and correlation with data from Protagen using the UNIchip®. Figure shows results from 3P analysis of four HuCAL® derived IgG molecules that were previously analyzed by Protagen using the UNIchip® on a fee-for-service basis. Results shown as OTA from Protagen’s analysis are indicated below the 3P results. In 3P, as expected, strong binding to the target (cell surface receptor 2) was observed for all antibodies. For two IgGs, MOR mAb A1 and A2, no unspecific binding was observed (see Σ CBR = 125 and 161, green shaded). The degree of unspecific binding of MOR mAb A3 and mAB A4 was ranked with moderate to high (Σ CBR = 394, light red shaded) and moderate (Σ CBR = 250, yellow shaded), respectively. Overall, the 3P and Protagen UNIchip® results are in good qualitative agreement.

Figure 4.3P analysis of 17 HuCAL® derived IgG molecules (targeted against a cytokine). Figure shows results from 3P analysis of 17 different HuCAL® derived IgG molecules that had been generated against cytokine 2 and tested during discovery phase. As expected, IgGs recognized their target (cytokine 2, row L on plate 1, e.g., MOR mAb B9) or its closest homolog, cytokine 4 (rows B on plate 1 and O on plate 2, e.g., MOR mAb B7). As previously observed in FACS and ELISA, MOR mAb B15 was found to be cross-reactive to both cytokine 2 and cytokine 4. A total of 12 IgG molecules were ranked with no/low degree of unspecific binding, two showed a moderate and three molecules showed a high degree of unspecific binding. The MOR mAb B1 had been analyzed as a replicate in an independent experiment (Σ CBR = 830 and 1,025, respectively) to assess the inter-assay reproducibility.
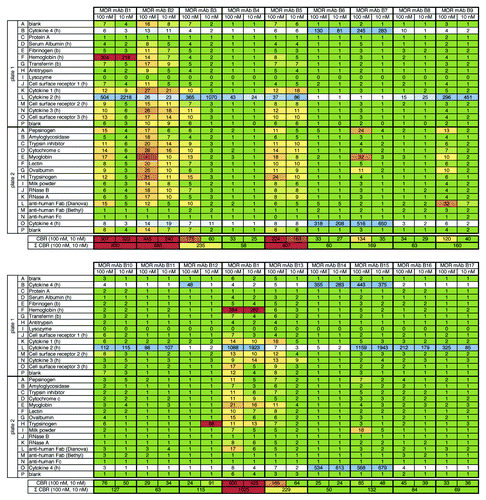
Figure 4.3P analysis of 17 HuCAL® derived IgG molecules (targeted against a cytokine). Figure shows results from 3P analysis of 17 different HuCAL® derived IgG molecules that had been generated against cytokine 2 and tested during discovery phase. As expected, IgGs recognized their target (cytokine 2, row L on plate 1, e.g., MOR mAb B9) or its closest homolog, cytokine 4 (rows B on plate 1 and O on plate 2, e.g., MOR mAb B7). As previously observed in FACS and ELISA, MOR mAb B15 was found to be cross-reactive to both cytokine 2 and cytokine 4. A total of 12 IgG molecules were ranked with no/low degree of unspecific binding, two showed a moderate and three molecules showed a high degree of unspecific binding. The MOR mAb B1 had been analyzed as a replicate in an independent experiment (Σ CBR = 830 and 1,025, respectively) to assess the inter-assay reproducibility.
Supplemental material

Additional material

Download Zip (113 KB)

Reprints and Corporate Permissions

Please note: Selecting permissions does not provide access to the full text of the article, please see our help page How do I view content?

To request a reprint or corporate permissions for this article, please click on the relevant link below:

Academic Permissions

Please note: Selecting permissions does not provide access to the full text of the article, please see our help page How do I view content?

Obtain permissions instantly via Rightslink by clicking on the button below:

If you are unable to obtain permissions via Rightslink, please complete and submit this Permissions form. For more information, please visit our Permissions help page.