Figures & data
Figure 1. Engineering CTLA4-Ig variants for increased binding to CD80 and CD86. (A) and (B) Using known complex structures, Citation17,Citation18 CTLA4 molecules (blue) are shown interacting with CD80 (A), dark magenta) and CD86 (B), light magenta). CTLA4 residues within contact distance of CD86 targeted for substitution are shown in stick format, along with neighboring residues in CD80 or CD86. Six positions at which substitutions significantly improved affinity for CD80 or CD86 are labeled. (C) Dissociation rates (koff) of CTLA4-Ig variants for CD80 and CD86, relative to abatacept. Shown are abatacept (open square, obscured on the 1-fold CD80-CD86 intercept), belatacept (open circle), and 131 single substitution CTLA4-Ig variants (solid diamonds), including the five listed variants with the highest increase in affinity. (D) Equilibrium dissociation constants (KD) of CTLA4-Ig variants for CD80 and CD86, relative to abatacept. Shown are abatacept (open square at intercept), belatacept (open circle) and 17 multiple-substitution CTLA4-Ig variants (solid diamonds). HNEQ (star) is the selected precursor CTLA4-Ig containing the four substitutions (A29H, T51N, L61E, K93Q) present in XPro9523. (E) Summary of binding data for best single and combination CTLA4-Ig variants. Fold improvements in KD relative to abatacept are shown for CD80 (black bars) and CD86 (gray bars). Bars are overlapping, and belatacept is included for comparison.
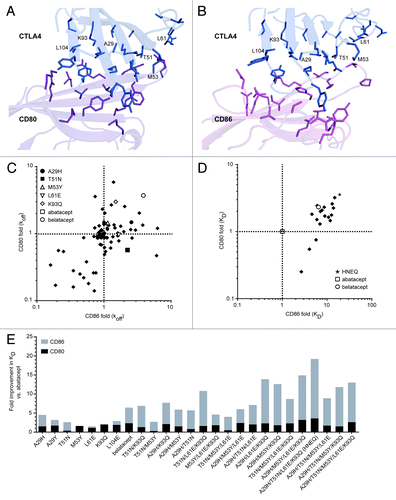
Table 1. Summary of changes in dissociation rate for CTLA4-Ig variants binding to CD80 or CD86
Figure 2. Surface plasmon resonance (SPR) analysis of CTLA4-Ig binding to CD80, CD86, and FcRn. SPR traces are shown for abatacept, belatacept, and XPro9523 binding to CD80 (top), CD86 (middle), and FcRn (bottom). SPR binding curves for CD80 were performed at 0.313, 0.625, 1.25, 2.5, 5.0, and 10.0 nM; binding curves for CD86 were performed at 0.078, 0.156, 0.313, 0.625, 1.25, and 2.5 nM; and binding curves for FcRn were performed at 62.5, 125, 250, and 500 nM.
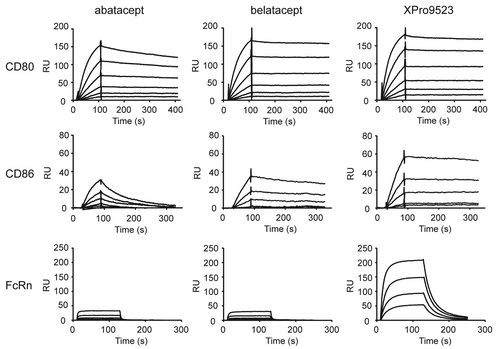
Table 2. Equilibrium dissociation values for abatacept, belatacept, and XPro9523 binding to CD80, CD86, and FcRn
Figure 3. Activity of XPro9523 relative to abatacept and belatacept in in vitro human T cell proliferation and mixed lymphocyte reaction (MLR) assays. (A) T cell proliferation. T cells were isolated from PBMCs and stimulated with anti-CD3 and recombinant CD86 in the presence of CTLA4-Ig, and incubated for 4 d prior to quantification of T cell number. The percent proliferation was determined as the fraction of cells with a decrease in CFSE mean fluorescence intensity. (B) MLR. PBMCs from two different donors were mixed in the presence of CTLA4-Igs, and IL2 induction was measured after 6 d. Values in (A) and (B) represent mean ± SEM of 2 replicates. Data shown in (A) are representative of two independent experiments, and in (B) are representative of at least 6 independent studies.
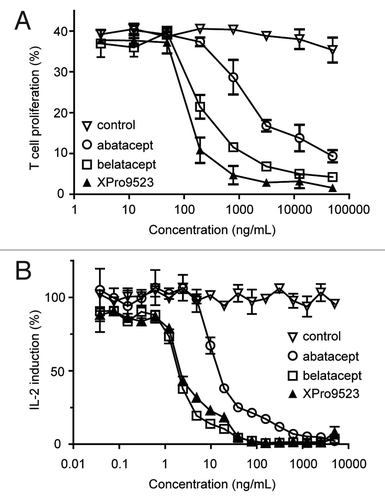
Figure 4. Suppression of mouse collagen-induced arthritis by XPro9523. XPro9523 was dosed twice weekly at 1, 3, or 10 mg/kg starting 2 d before immunization with collagen. Clinical score represents sum of swelling of four paws on a scale of 0 (normal) to 3 (severe). Values represent mean ± SEM from 10 mice per group. The p values shown represent 1-way repeat-measures ANOVA with Dunnett's post-test vs. PBS-treated group (*p < 0.05; ***p < 0.001).
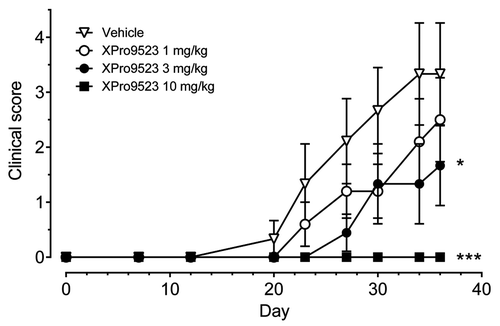
Figure 5. Receptor occupancy and inhibition of immune responses to KLH in monkeys given PBS, abatacept or XPro9523 (6 mg/kg). (A) CD80 (top) and CD86 (bottom) occupancy on CD20+ B cells measured in whole blood following administration of vehicle or CTLA4-Ig biologics. CD20+ B cells were identified in the lymphocyte gate as determined from forward vs. side scatter plots. Receptor occupancy is expressed as the percent of unbound CD80 or CD86 relative to pre-treatment baseline. (B) Suppression of primary and secondary antibody responses to KLH administered 24 h and 16 d after administration of vehicle or CTLA4-Ig biologics. Top graphs, anti-KLH IgG levels and bottom graphs, anti-KLH IgM levels at 11 d, 21 d, and 27 d following administration of vehicle or CTLA4-Ig. In (A) and (B) values represent mean ± SEM from 4 monkeys. The p values shown represent one-way ANOVA with Bonferroni’s post-test; *p < 0.05; **p < 0.01; ***p < 0.001; if unlabeled, not significant (p > 0.05). (C) Pharmacokinetic data. Left, serum concentrations over time. Right, half-life, area under the curve (AUC), and clearance (mean ± SEM of 4 monkeys). The p values shown represent unpaired t tests.
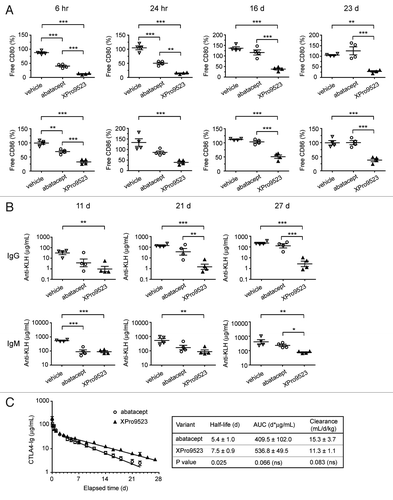
Figure 6. CD80 and CD86 receptor occupancy measured in whole blood from monkeys given PBS, belatacept, or XPro9523 (0.1, 0.5, or 2.0 mg/kg). Blood was stained with anti-human CD80 and CD86 antibodies cross-reactive with monkey antigens to compete with CTLA4 binding, as determined by anti-CD80 and anti-CD86 mean fluorescence intensity of CD20+ B cells after standardization for the number of antibodies bound. CD20+ B cells were identified in the lymphocyte gate as determined from forward vs. side scatter plots. Receptor occupancy is expressed as the percent of unbound CD80 or CD86 relative to pre-treatment baseline. Shown are percent free CD80 (left panels) and CD86 (right panels) on B cells at 6 h, 24 h, 16 d, or 23 d following administration of vehicle or CTLA4-Ig. Values represent mean ± SEM from 4 monkeys. The p values shown are for vehicle vs. the indicated dose of CTLA4-Ig, or for XPro9523 vs. belatacept (shown by bracket), and represent one-way ANOVA with Bonferroni’s post-test. *p < 0.05; **p < 0.01; ***p < 0.001; if unlabeled, not significant (p > 0.05).
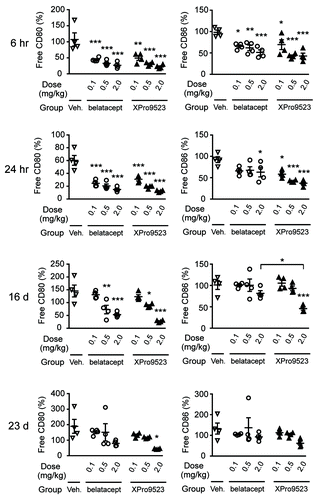
Figure 7. (A) Suppression of primary and secondary antibody responses to KLH in monkeys given PBS, belatacept, or XPro9523 (0.1, 0.5, or 2.0 mg/kg). KLH was administered 24 h and 16 d after administration of vehicle or CTLA4-Ig, and serum anti-KLH was determined using ELISA. Shown are anti-KLH IgG and IgM levels at 11 d (top panels) and 21 d (bottom panels) following administration of vehicle or CTLA4-Ig. Values represent mean ± SEM from 4 monkeys. The p values shown are for vehicle vs. the indicated dose of CTLA4-Ig and represent one-way ANOVA with Bonferroni’s post-test. *p < 0.05; **p < 0.01; ***p < 0.001; if unlabeled, not significant (p > 0.05). There was no statistical significance between belatacept and XPro9523 at any dose. (B) Pharmacokinetic data for 0.1, 0.5, or 2.0 mg/kg belatacept or XPro9523 administered to monkeys as a 1 h infusion. Shown are serum concentrations over time of abatacept and XPro9523 (values represent mean ± SEM of 4 animals). Pharmacokinetic parameters were determined for individual monkeys with a non-compartmental model. Half-lives were dose-dependent, with means of 3.7 ± 1.1 and 5.1 ± 0.3 d for belatacept and XPro9523 at the 2 mg/kg dose, respectively, suggesting a target sink effect.
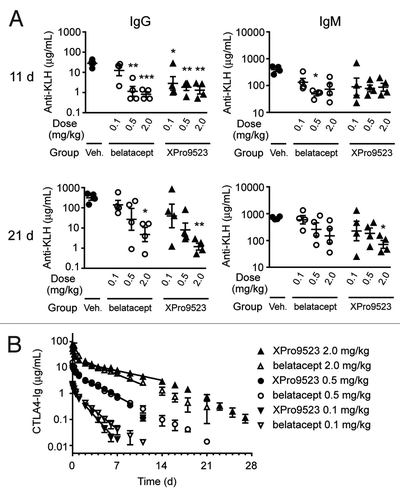
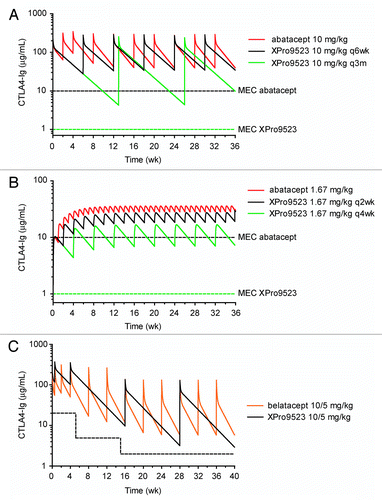
Figure 8. Simulated human pharmacokinetics of XPro9523. (A) I.V. dosing in RA. Abatacept is given at 10 mg/kg every other week for 4 wks, and every 4 wks thereafter (red line), generating serum levels well above the desired 10 μg/ml MEC (dashed black line). Simulations show that XPro9523 (black line) could be dosed every 6 wks while maintaining exposure comparable to abatacept. In simulations including the additional potency observed for XPro9523, dosing every 3 mo (green line) maintains trough concentrations ~4-fold above the anticipated MEC of 1 μg/ml (dashed green line). (B) S.C. dosing in RA. Simulations indicate that XPro9523 could be dosed every 2 wks (black line) or 4 wks (green line) (modeled as 125 mg in a 75 kg patient) while maintaining serum levels greater than the 10 or 1 μg/ml predicted MEC, respectively (dashed black and green lines). (C) I.V. dosing in renal transplant. Belatacept is administered as 10 mg/kg doses on days 1 and 5 and weeks 2, 4, 8, and 12, followed by maintenance dosing of 5 mg/kg every 4 wks. Simulations revealed that XPro9523 (black line) could be dosed much less frequently while maintaining exposure comparable to belatacept (orange line) and well above the desired MEC of 20, 5, and 2 μg/ml during months 1, 2 to 3, and 4 to 6, respectively, after transplantation (dashed black line). Notably, doses at 2, 8, and 12 wks would be unnecessary for XPro9523, and maintenance dosing could be every 12 instead of every 4 wks