2,504
Views
52
CrossRef citations to date
0
Altmetric
Report

Comparison of the in vitro and in vivo stability of a succinimide intermediate observed on a therapeutic IgG1 molecule

, , , &
Pages 432-444 | Received 03 Jan 2013, Accepted 26 Mar 2013, Published online: 22 Apr 2013

Figures & data

Figure 1. Deamidation at neutral or basic pH > 6 proceeds through the cyclic imide succinimide followed by hydrolysis to Asp/iso-Asp with a resulting mass change of +1Da.
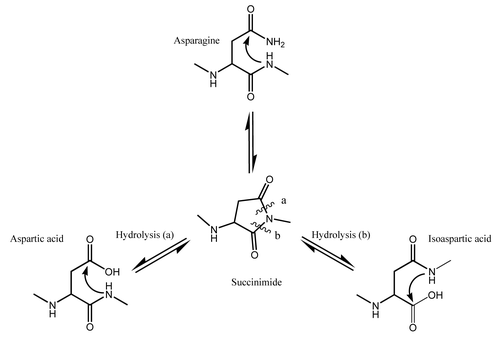
Figure 1. Deamidation at neutral or basic pH > 6 proceeds through the cyclic imide succinimide followed by hydrolysis to Asp/iso-Asp with a resulting mass change of +1Da.

Figure 2. Analysis of mAb-1 by HIC showing atypical heterogeneity (peaks 1–5).

Figure 2. Analysis of mAb-1 by HIC showing atypical heterogeneity (peaks 1–5).

Figure 3. Reverse phase ESI-Q-TOF MS analysis of (A) reduced HIC fractionated peak 3 and (B) reduced HIC fractionated peak 4 showing the MW of the deconvoluted mass spectra of the HC. The theoretical MW of the reduced HC of mAb-1 (G0) is 50,885 Da.
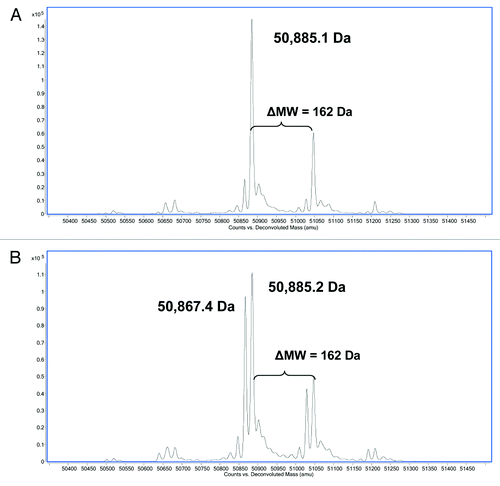
Figure 3. Reverse phase ESI-Q-TOF MS analysis of (A) reduced HIC fractionated peak 3 and (B) reduced HIC fractionated peak 4 showing the MW of the deconvoluted mass spectra of the HC. The theoretical MW of the reduced HC of mAb-1 (G0) is 50,885 Da.

Figure 4. Reverse phase LC/MS extracted ion chromatograms of acidic tryptic digests of (A) HIC fractionated peak 4 and (B) peak 3. The EIC shows the HC99–130 tryptic peptide (MW = 3583.5 Da) and the corresponding tryptic peptide containing a 17 Da modification (MW = 3566.5 Da).
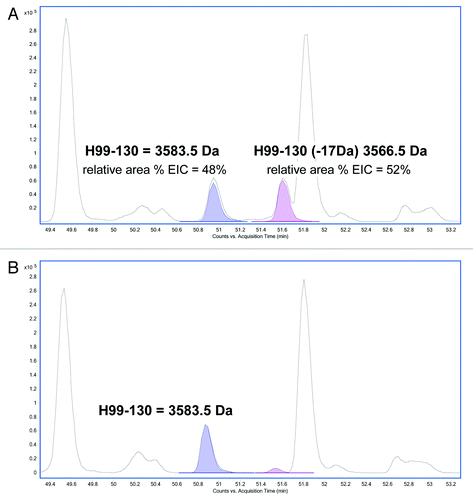
Figure 4. Reverse phase LC/MS extracted ion chromatograms of acidic tryptic digests of (A) HIC fractionated peak 4 and (B) peak 3. The EIC shows the HC99–130 tryptic peptide (MW = 3583.5 Da) and the corresponding tryptic peptide containing a 17 Da modification (MW = 3566.5 Da).

Figure 5. MS/MS spectra obtained from the CID fragmentation of (A) HC99–130 tryptic peptide with a 17 Da mass shift and (B) unmodified HC99–130 tryptic peptide from HIC fractionated peak 4.
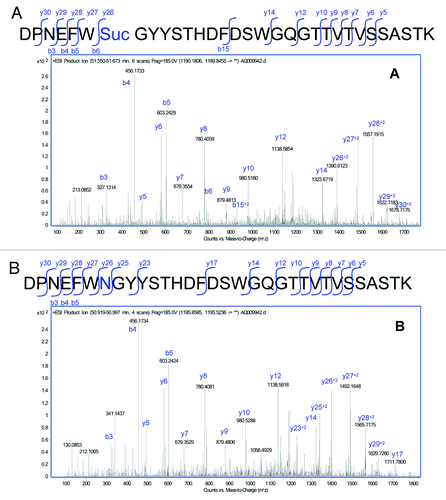
Figure 5. MS/MS spectra obtained from the CID fragmentation of (A) HC99–130 tryptic peptide with a 17 Da mass shift and (B) unmodified HC99–130 tryptic peptide from HIC fractionated peak 4.

Figure 6. HIC fractionation of mAb-1 (A) unfractionated mAb-1, (B) fractionated unmodified (HC Asn105) mAb-1 (peak 3), (C) fractionated mAb-1 containing one HC succinimide105 species (peak 4), (D) fractionated mAb-1 containing two HC succinimide105 species (peak 5).
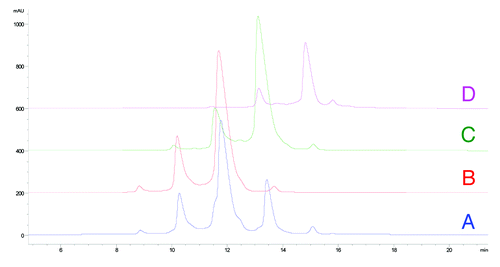
Figure 6. HIC fractionation of mAb-1 (A) unfractionated mAb-1, (B) fractionated unmodified (HC Asn105) mAb-1 (peak 3), (C) fractionated mAb-1 containing one HC succinimide105 species (peak 4), (D) fractionated mAb-1 containing two HC succinimide105 species (peak 5).

Table 1. Binding affinity (KD (M) of mAb-1 with no modification (HC Asn105); one HC succinimide105 modification; two HC succinimide105 modifications and HC Asn105 to Asp105 point mutation

Figure 7. In vitro stability of peak 3 at (A) pH 6 showing rapid formation of succinimide at elevated temperatures and (B) pH 5 with slower kinetics of succinimide formation.
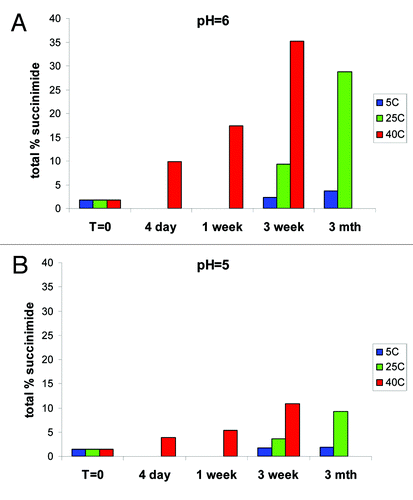
Figure 7. In vitro stability of peak 3 at (A) pH 6 showing rapid formation of succinimide at elevated temperatures and (B) pH 5 with slower kinetics of succinimide formation.

Figure 8. In vitro stability of HIC fractionated peak 3 at pH of 4, 5, 6, 7 and 8 demonstrating the relative increase of the succinimide (Asu) and Asp/iso-Asp species after 3 weeks at 25°C.
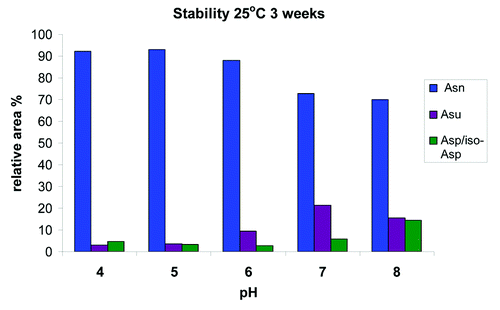
Figure 8. In vitro stability of HIC fractionated peak 3 at pH of 4, 5, 6, 7 and 8 demonstrating the relative increase of the succinimide (Asu) and Asp/iso-Asp species after 3 weeks at 25°C.

Figure 9. Representative reverse phase LC/MS extracted ion chromatogram of acidic tryptic digests of mAb-1 recovered from serum showing the EIC’s of HC99–130 tryptic peptide (MW = 3583.5 Da) and the corresponding tryptic peptide containing the succinimide (Asu) modification (MW = 3566.5 Da) and the Asp and iso-Asp modification (MW 3584.5 Da).
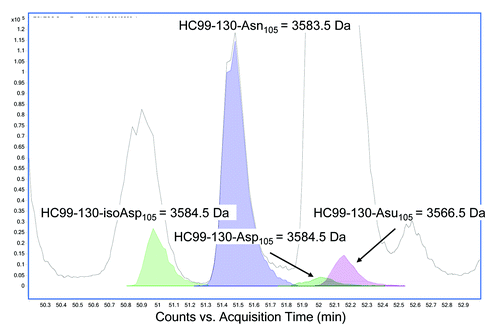
Figure 9. Representative reverse phase LC/MS extracted ion chromatogram of acidic tryptic digests of mAb-1 recovered from serum showing the EIC’s of HC99–130 tryptic peptide (MW = 3583.5 Da) and the corresponding tryptic peptide containing the succinimide (Asu) modification (MW = 3566.5 Da) and the Asp and iso-Asp modification (MW 3584.5 Da).

Figure 10. (A) In vivo stability of mAb-1 recovered from serum (B) In vitro stability of HIC fractionated peak 3 at pH 7 and temperature of 40°C for 3 weeks. Studies in vivo show increase in total deamidation over time and loss of stability of the succinimide (Asu) intermediate.
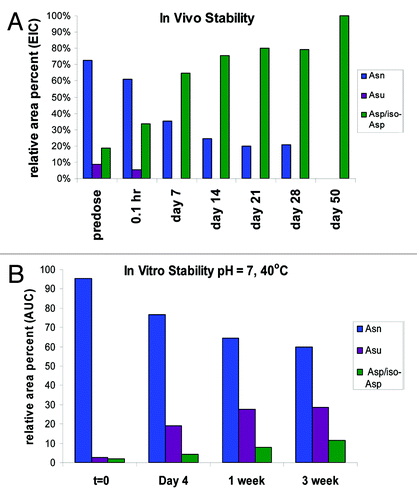
Figure 10. (A) In vivo stability of mAb-1 recovered from serum (B) In vitro stability of HIC fractionated peak 3 at pH 7 and temperature of 40°C for 3 weeks. Studies in vivo show increase in total deamidation over time and loss of stability of the succinimide (Asu) intermediate.

Figure 11. (A) SEC-Static Light scattering data of mAb1 showing similar MW of monomer and a shoulder species observed in mAb-1. SEC QELS data of mAb1 showing: (B) native monomer species with expected hydrodynamic radius of 5.3 nM, and (C) later eluting shoulder species with one HC succinimide 105 with a smaller hydrodynamic radius of 4.2 nM.
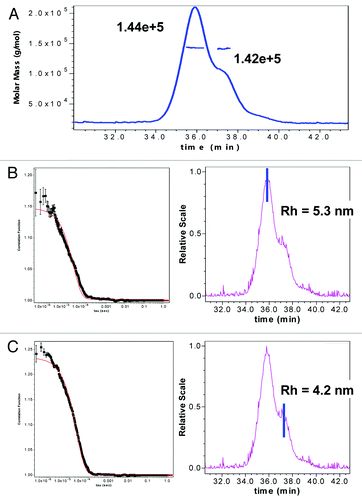
Figure 11. (A) SEC-Static Light scattering data of mAb1 showing similar MW of monomer and a shoulder species observed in mAb-1. SEC QELS data of mAb1 showing: (B) native monomer species with expected hydrodynamic radius of 5.3 nM, and (C) later eluting shoulder species with one HC succinimide 105 with a smaller hydrodynamic radius of 4.2 nM.

Figure 12. (A) Hydrophobic rich region in CDR3. There are four hydrophobic residues with high solvent accessibility shown in the figure: Phe103, Trp104, Tyr107 and Tyr108. (B) Expanded view of Asn(succinimide)105 and Trp104. The two π bond rich systems have close to a planar relationship as is typical for π stacking interactions. (C) Tertiary alignment of molecular models of Fabs. The energy minimized model of the CDR3 containing an asparagine at position 105 is shown in magenta and the energy minimized region showing the cyclic imide (succinimide105) is shown in teal. Changes to both structures are observed in both the backbone and side chain orientations within CDR3. (D) Comparison of the backbones of the two energy minimized regions of the native structure and the stable cyclic imide.
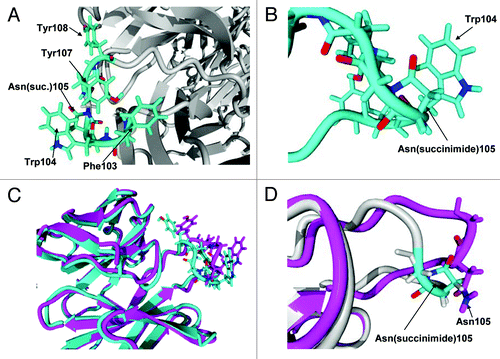
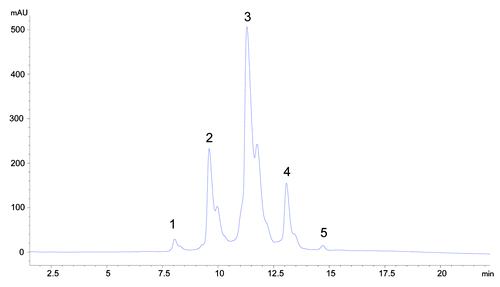
Figure 12. (A) Hydrophobic rich region in CDR3. There are four hydrophobic residues with high solvent accessibility shown in the figure: Phe103, Trp104, Tyr107 and Tyr108. (B) Expanded view of Asn(succinimide)105 and Trp104. The two π bond rich systems have close to a planar relationship as is typical for π stacking interactions. (C) Tertiary alignment of molecular models of Fabs. The energy minimized model of the CDR3 containing an asparagine at position 105 is shown in magenta and the energy minimized region showing the cyclic imide (succinimide105) is shown in teal. Changes to both structures are observed in both the backbone and side chain orientations within CDR3. (D) Comparison of the backbones of the two energy minimized regions of the native structure and the stable cyclic imide.

Reprints and Corporate Permissions

Please note: Selecting permissions does not provide access to the full text of the article, please see our help page How do I view content?

To request a reprint or corporate permissions for this article, please click on the relevant link below:

Academic Permissions

Please note: Selecting permissions does not provide access to the full text of the article, please see our help page How do I view content?

Obtain permissions instantly via Rightslink by clicking on the button below:

If you are unable to obtain permissions via Rightslink, please complete and submit this Permissions form. For more information, please visit our Permissions help page.