2,217
Views
44
CrossRef citations to date
0
Altmetric
Brief Report

Conformational stability and aggregation of therapeutic monoclonal antibodies studied with ANS and Thioflavin T binding

Pages 408-411 | Received 03 May 2011, Accepted 01 Apr 2011, Published online: 01 Jul 2011

Figures & data

Figure 1 Key structures of the mAb probed by fluorescent dyes. N and U are native and unfolded monomers, respectively. “n” reactive monomers form aggregates.
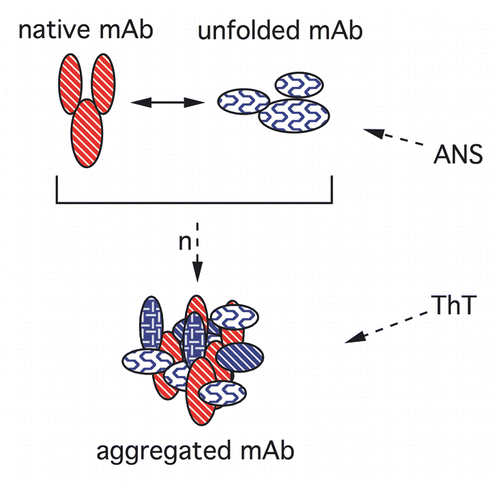
Figure 1 Key structures of the mAb probed by fluorescent dyes. N and U are native and unfolded monomers, respectively. “n” reactive monomers form aggregates.

Figure 2 Binding of ANS to the mAb. (A) ANS binding equilibrium to native mAb with increasing dye concentration. Inset: Double reciprocal representation.Citation20 (B) Temperature-dependence of mAb unfolding studied with ANS binding. Dye binding rates were determined from these data as described in the text and shown in .
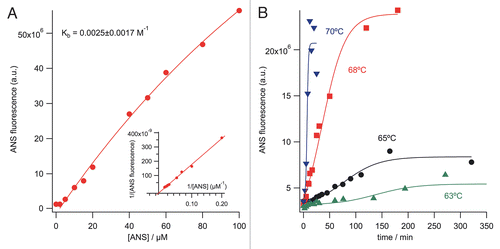
Figure 2 Binding of ANS to the mAb. (A) ANS binding equilibrium to native mAb with increasing dye concentration. Inset: Double reciprocal representation.Citation20 (B) Temperature-dependence of mAb unfolding studied with ANS binding. Dye binding rates were determined from these data as described in the text and shown in Table 1.

Figure 3 Arrhenius plots for unfolding and aggregate formation of the mAb as a function of temperature (63–70°C). Rate constants were calculated with the first-order reaction for both of the proteins' unfolding and aggregation with the empirical sigmoid fit function. SEC-HPLC results (55–68°C) were calculated using the second-order reaction rate. Data fit was performed using Arrhenius equation (ln kobs = ln A − Ea/RT). The activation energies for the mAb unfolding and aggregation from the ANS and ThT binding and SEC-HPLC experiments are 610, 544 and 549 kJ/mol, respectively.
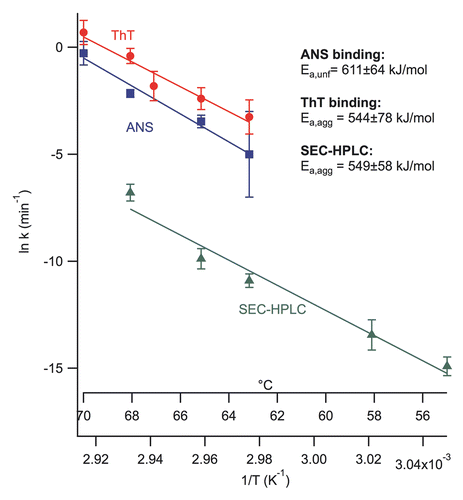
Figure 3 Arrhenius plots for unfolding and aggregate formation of the mAb as a function of temperature (63–70°C). Rate constants were calculated with the first-order reaction for both of the proteins' unfolding and aggregation with the empirical sigmoid fit function. SEC-HPLC results (55–68°C) were calculated using the second-order reaction rate. Data fit was performed using Arrhenius equation (ln kobs = ln A − Ea/RT). The activation energies for the mAb unfolding and aggregation from the ANS and ThT binding and SEC-HPLC experiments are 610, 544 and 549 kJ/mol, respectively.

Table 1 Observed unfolding and aggregation rate constants of the mAb by the dye-binding studies

Supplemental material

Additional material

Download Zip (598.8 KB)

Reprints and Corporate Permissions

Please note: Selecting permissions does not provide access to the full text of the article, please see our help page How do I view content?

To request a reprint or corporate permissions for this article, please click on the relevant link below:

Academic Permissions

Please note: Selecting permissions does not provide access to the full text of the article, please see our help page How do I view content?

Obtain permissions instantly via Rightslink by clicking on the button below:

If you are unable to obtain permissions via Rightslink, please complete and submit this Permissions form. For more information, please visit our Permissions help page.