2,470
Views
32
CrossRef citations to date
0
Altmetric
Short Communication

An innovative approach for the characterization of the isoforms of a monoclonal antibody product

, , , , , , , & show all
Pages 505-512 | Received 23 Jun 2011, Accepted 14 Sep 2011, Published online: 04 Nov 2011

Figures & data

Figure 1 Comparison of the isoforms of different lots of IgG1 product produced using Process 1 and 2. (A and J) Markers; (B) Process 1, Lot 1; (C) Process 1, Lot 2; (D) Process 2, Lot 1; (E) Process 2, Lot 2; (F) Lot 1, Location 1; (G) Lot 2, Location 2; (H) Lot 3, Location 1; (I) Lot 4, Location 2.
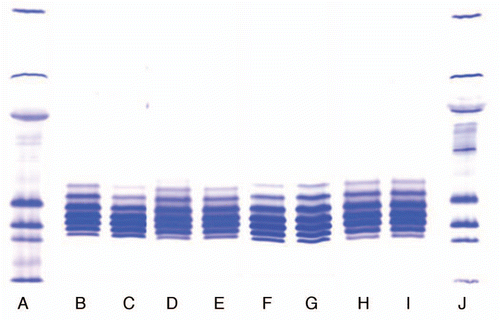
Figure 1 Comparison of the isoforms of different lots of IgG1 product produced using Process 1 and 2. (A and J) Markers; (B) Process 1, Lot 1; (C) Process 1, Lot 2; (D) Process 2, Lot 1; (E) Process 2, Lot 2; (F) Lot 1, Location 1; (G) Lot 2, Location 2; (H) Lot 3, Location 1; (I) Lot 4, Location 2.

Figure 2 Comparison of isoforms of the IgG1 product prepared with Process 3 in two locations. (F) Marker; (G) Lot 1, Location 1; (H) Lot 2, Location 2; (I) Lot 3, Location 1; (J) Lot 4, Location 4.
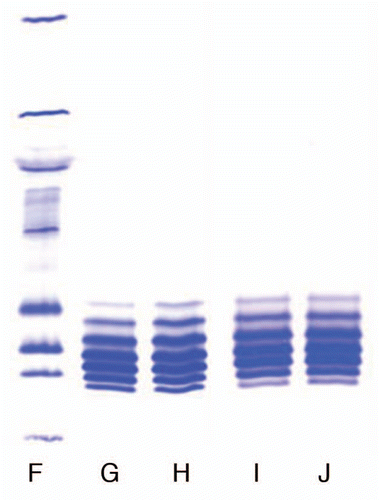
Figure 2 Comparison of isoforms of the IgG1 product prepared with Process 3 in two locations. (F) Marker; (G) Lot 1, Location 1; (H) Lot 2, Location 2; (I) Lot 3, Location 1; (J) Lot 4, Location 4.

Figure 3 Negative-ion MALDI spectrum of 2-AA N-linked glycans released from IgG1 product RS by PNGase F. Sugar residues are GlcNAc (blue square), Fuc (yellow triangle), Man (green circle), Gal (pink circle) and NGNA (black diamond).
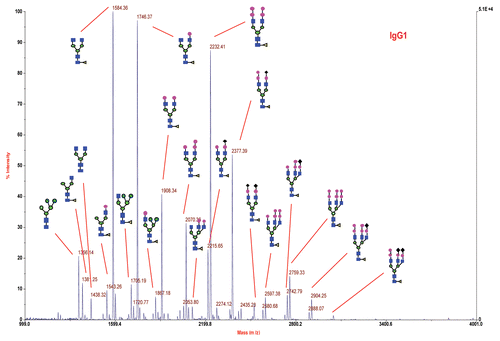
Figure 3 Negative-ion MALDI spectrum of 2-AA N-linked glycans released from IgG1 product RS by PNGase F. Sugar residues are GlcNAc (blue square), Fuc (yellow triangle), Man (green circle), Gal (pink circle) and NGNA (black diamond).

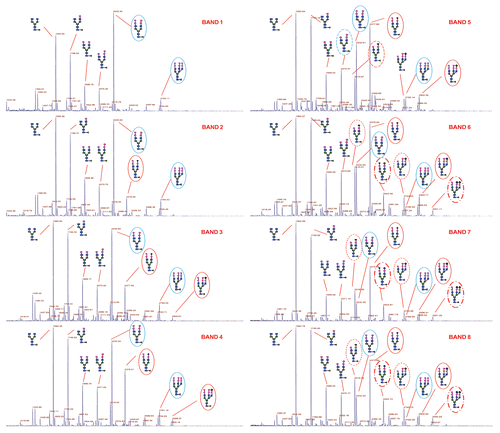
Figure 4 Relative abundance of selected oligosaccharides in each band (isoform).

Figure 4 Relative abundance of selected oligosaccharides in each band (isoform).

Figure 5 Effect of sialidase and carboxypeptidase treatment on the IgG1 product. The Isoforms 1 and 2 are not present in the sialidase and carboxy peptidase treated sample but they are present in sialidase treated sample. Isoforms 6, 7, 8 are not present in sialidase treated sample indicating that they contain sialic acid.
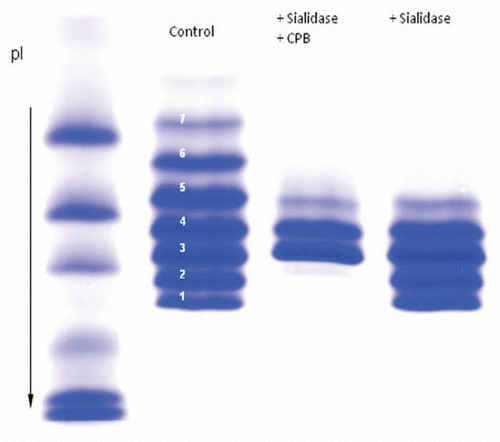
Figure 5 Effect of sialidase and carboxypeptidase treatment on the IgG1 product. The Isoforms 1 and 2 are not present in the sialidase and carboxy peptidase treated sample but they are present in sialidase treated sample. Isoforms 6, 7, 8 are not present in sialidase treated sample indicating that they contain sialic acid.

Figure 6 LC/MS/MS peptide map of IgG1 isoforms. The percent of Lysine of the isoforms 1–8 were determined to be 80.2, 54.3, 21.0, 14.3, 8.5, 5.4, 5.1 and 5.7, respectively indicating lysine truncation in isoforms 5–8.
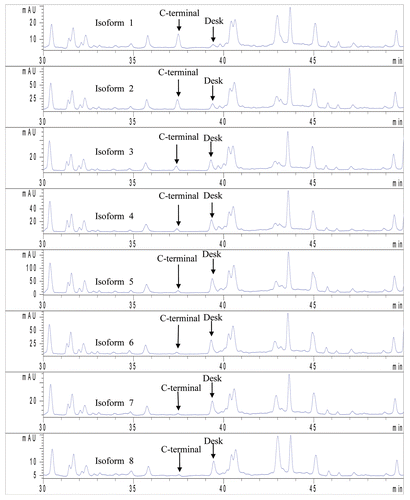
Figure 6 LC/MS/MS peptide map of IgG1 isoforms. The percent of Lysine of the isoforms 1–8 were determined to be 80.2, 54.3, 21.0, 14.3, 8.5, 5.4, 5.1 and 5.7, respectively indicating lysine truncation in isoforms 5–8.

Table 1 Relative abundance of oligosaccharides verse G0F for each band

Table 2 Biological activity of the IgG1 product
Reprints and Corporate Permissions

Please note: Selecting permissions does not provide access to the full text of the article, please see our help page How do I view content?

To request a reprint or corporate permissions for this article, please click on the relevant link below:

Academic Permissions

Please note: Selecting permissions does not provide access to the full text of the article, please see our help page How do I view content?

Obtain permissions instantly via Rightslink by clicking on the button below:

If you are unable to obtain permissions via Rightslink, please complete and submit this Permissions form. For more information, please visit our Permissions help page.