Figures & data
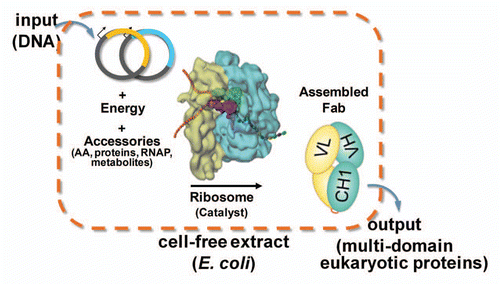
Figure 1 Schematic diagram of the open cell-free synthesis (OCFS) system. Energy required for transcription-translation is driven by glutamate catabolism via the TCA cycle to produce reducing equivalents, primarily in the form of NADH, which fuels oxidative phosphorylation providing a stable supply of ATP over the course of the 10 h cell-free protein synthesis reaction. Addition of T7-RNA polymerase (RNAP), individual HC and LC T7-based plasmids or linear template for scFv, with amino acids drives transcription and subsequent ribosomal translation followed by protein folding, assisted by added glutathione and disulfide isomerase chaperone.

Figure 2 Schematic diagram illustrating high throughput optimization of translation initiation and scalable scFv expression. (A) T7-based TIR linear template libraries from gene synthesized 200-mer ds DNA fragments were (B) individually assembled by overlap extension PCR, purified and quantitated using PicoGreen. (C) Cell-free expression yields were significantly improved for several TIR library clones, relative to the starting, reference Citation5′ UTR sequence. Expression of duplicate clones from assembled linear DNA templates was measured by [14C]-leucine incorporation at 5 h in a 96-well format. Reactions contained ≥30 nM linear DNA template stabilized by 1 µM λ-GamS protein. Error bars correspond to 1 sec.d. of replicate protein expression yields from independently synthesized and assembled linear DNA templates. (D) BIACORE analysis confirms the functional activity of the anti-IL-23 scFv produced by the OCFS system with KD = 2 nM. (E) The kinetics of soluble production of anti-hIL-23 scFv up to 5 L is linearly scalable in the OCFS system. The concentrations of anti-hIL-23 scFv were determined by [14C]-leucine incorporation at 250 µL or less, and by BIACORE analysis at larger scales, as described in the Materials and Methods. CVs were ≤10% and the proteins were ≥95% soluble for all time points. The solid lines are for illustration purposes only.
![Figure 2 Schematic diagram illustrating high throughput optimization of translation initiation and scalable scFv expression. (A) T7-based TIR linear template libraries from gene synthesized 200-mer ds DNA fragments were (B) individually assembled by overlap extension PCR, purified and quantitated using PicoGreen. (C) Cell-free expression yields were significantly improved for several TIR library clones, relative to the starting, reference Citation5′ UTR sequence. Expression of duplicate clones from assembled linear DNA templates was measured by [14C]-leucine incorporation at 5 h in a 96-well format. Reactions contained ≥30 nM linear DNA template stabilized by 1 µM λ-GamS protein. Error bars correspond to 1 sec.d. of replicate protein expression yields from independently synthesized and assembled linear DNA templates. (D) BIACORE analysis confirms the functional activity of the anti-IL-23 scFv produced by the OCFS system with KD = 2 nM. (E) The kinetics of soluble production of anti-hIL-23 scFv up to 5 L is linearly scalable in the OCFS system. The concentrations of anti-hIL-23 scFv were determined by [14C]-leucine incorporation at 250 µL or less, and by BIACORE analysis at larger scales, as described in the Materials and Methods. CVs were ≤10% and the proteins were ≥95% soluble for all time points. The solid lines are for illustration purposes only.](/cms/asset/65d088f8-0fc6-45fd-95bc-bc44af4c2289/kmab_a_10919202_f0002.gif)
Figure 3 Rapid combinatorial optimization of Fab assembly in the OCFS system. (A) The expression and covalent assembly of soluble anti-IL13aR Fab was measured by autoradiography of non-reducing SDS PAGE of [14C]-leucine incorporated product as a function of added GSSG and GSH with 10 µM DsbC chaperone. (B) Response surface of the fraction of heavy chain (HC) plasmid, fHC and sum of added heavy and light chain (LC) plasmids on covalent assembly of anti-IL-13α1R Fab. Fab assembly was monitored by [14C]-autoradiography of non-reducing SDS-PAGE gels to quantitate the soluble Fab assembled protein yield. (C) Staggered expression of LC for 1 h, followed by addition of HC plasmid for an additional 7 h. Under optimized conditions, the yield of Fab was 300 mg/L and was >95% soluble at all time points. (D) BIAcore analysis of purified anti-hIL-13Rα1 Fab binding to immobilized hIL-13α1 R. Fab concentrations were 3.9 pM, 11.7 pM, 35 pM, 105 pM and 315 pM. The data in red were globally fit to a 1:1 isotherm as indicated by the black lines, with kon = 2 × 10⁸ M−1s−1, koff = 4 × 10⁻⁴ s−1, KD = 2 pM. (E) The kinetics of soluble production of anti-IL-13α1R Fab up to 4 L is linearly scalable in the OCFS system. The concentrations of Fab were determined by [14C]-leucine incorporation at 250 µL or less, and by ForteBio analysis at larger scales (Fig. S4). CVs were ≤10% and the proteins were ≥95% soluble for all time points. The solid line is for illustration purposes only.
![Figure 3 Rapid combinatorial optimization of Fab assembly in the OCFS system. (A) The expression and covalent assembly of soluble anti-IL13aR Fab was measured by autoradiography of non-reducing SDS PAGE of [14C]-leucine incorporated product as a function of added GSSG and GSH with 10 µM DsbC chaperone. (B) Response surface of the fraction of heavy chain (HC) plasmid, fHC and sum of added heavy and light chain (LC) plasmids on covalent assembly of anti-IL-13α1R Fab. Fab assembly was monitored by [14C]-autoradiography of non-reducing SDS-PAGE gels to quantitate the soluble Fab assembled protein yield. (C) Staggered expression of LC for 1 h, followed by addition of HC plasmid for an additional 7 h. Under optimized conditions, the yield of Fab was 300 mg/L and was >95% soluble at all time points. (D) BIAcore analysis of purified anti-hIL-13Rα1 Fab binding to immobilized hIL-13α1 R. Fab concentrations were 3.9 pM, 11.7 pM, 35 pM, 105 pM and 315 pM. The data in red were globally fit to a 1:1 isotherm as indicated by the black lines, with kon = 2 × 10⁸ M−1s−1, koff = 4 × 10⁻⁴ s−1, KD = 2 pM. (E) The kinetics of soluble production of anti-IL-13α1R Fab up to 4 L is linearly scalable in the OCFS system. The concentrations of Fab were determined by [14C]-leucine incorporation at 250 µL or less, and by ForteBio analysis at larger scales (Fig. S4). CVs were ≤10% and the proteins were ≥95% soluble for all time points. The solid line is for illustration purposes only.](/cms/asset/de79285d-caa2-489a-b691-0b856a365807/kmab_a_10919202_f0003.gif)
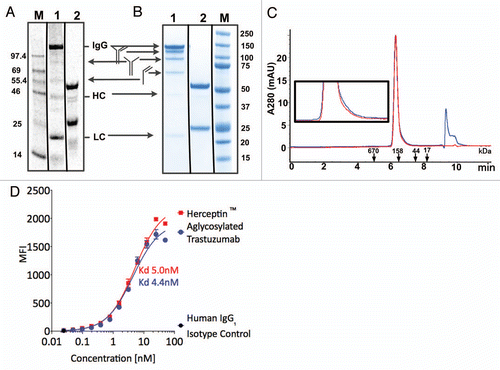
Figure 4 Analytical characterization of aglycosylated trastuzumab produced in the OCFS system. (A) Cell-free reaction product pool was visualized, using SDS-PAGE, by 14C autoradiography of leucine incorporation at 10 h. that measures only protein produced. Lane M: MW Marker, Lane 1, non-reducing, Lane 2, reducing. Autoradiography of the cell-free reaction product indicates 14C-leucine incorporation corresponding to ca. 400 mg/L production of full-length trastuzumab IgG1, as well as HC and LC, and confirms that only antibody was produced because the T7 RNA polymerase limits transcription to the T7 promoter on the plasmid added to the reaction, with no evidence for aberrant protein products produced from native RNA polymerase transcription. (B) SDS-PAGE analysis of purified protein. Following purification, non-reduced and reduced samples were analyzed with Coomassie blue staining following electrophoresis. Lane 1: 2 µg aglycosylated trastuzumab-non-reducing, Lane 2: 2 µg aglycosylated trastuzumab-reducing, Lane M: Precision Plus (BioRad) Marker Lane. (C) Analytical size exclusion chromatography of Herceptin® (red) and aglycosylated trastuzumab (blue). The peak at 9.5–10 min corresponds to buffer. (Inset) Enlarged view of traces. (D) FACS analysis of aglycosylated trastuzumab produced by OCFS and Herceptin® binding to HER2 overexpressing SK-BR-3 cells. The equilibrium KD corresponds to 5.0 nM and 4.4 nM, respectively. Control experiments showed that binding of aglycosylated trastuzumab is specifically competed with Herceptin® (data not shown).
