Figures & data
Figure 1. Specificity of the Sirt6 antibody. (A) An anti-FLAG antibody and the anti-Sirt6 antibody that was generated for this study were perfectly co-localized in cells overexpressing Sirt6 (first row). HeLa cells transfected with FLAG-tagged Sirt1, Sirt7 or HA-tagged Sirt2 did not show any increase in the Sirt6 signal, indicating a lack of cross-reactivity of the antibody with other nuclear sirtuins (rows 2–4). Plot profile analysis of selected cells are shown on the right. (B) In a western blot of the lysate of Sirt6-overexpressing cells, the Sirt6 antibody [Sirt6 (M)] detected the same 49 kDa band as the FLAG antibody. Compared with the bands detected by commercial anti-Sirt6 antibodies against its N- and C-termini [Sirt6 (N) and Sirt6(C), respectively], Sirt6 (M) detected one extra lower-molecular weight band, as did the Sirt6(C) antibody. The identity of the lower-molecular weight Sirt6 remains unknown. Scale bar, 10 µm.
![Figure 1. Specificity of the Sirt6 antibody. (A) An anti-FLAG antibody and the anti-Sirt6 antibody that was generated for this study were perfectly co-localized in cells overexpressing Sirt6 (first row). HeLa cells transfected with FLAG-tagged Sirt1, Sirt7 or HA-tagged Sirt2 did not show any increase in the Sirt6 signal, indicating a lack of cross-reactivity of the antibody with other nuclear sirtuins (rows 2–4). Plot profile analysis of selected cells are shown on the right. (B) In a western blot of the lysate of Sirt6-overexpressing cells, the Sirt6 antibody [Sirt6 (M)] detected the same 49 kDa band as the FLAG antibody. Compared with the bands detected by commercial anti-Sirt6 antibodies against its N- and C-termini [Sirt6 (N) and Sirt6(C), respectively], Sirt6 (M) detected one extra lower-molecular weight band, as did the Sirt6(C) antibody. The identity of the lower-molecular weight Sirt6 remains unknown. Scale bar, 10 µm.](/cms/asset/03ecd484-37a6-4f12-a80d-9e88e72df992/kncl_a_10921134_f0001.gif)
Figure 2. Sub-nuclear localization of endogenous Sirt6. (A) Asynchronous HeLa cells stained with anti-Sirt6 (M) show both nucleoplasmic and nucleolar staining. (B) Compared with cells cultured under normal conditions, serum deprivation causes the nucleolar Sirt6 signal to increase, while actinomycin D treatment causes nucleolar Sirt6 to be released into the nucleoplasm. (C) Sirt6 does not co-localize with intense DAPI staining, especially in the perinucleolar region. AMD, actinomycin D; NL, normal; SD, serum deprivation. Scale bars, 10 µm.
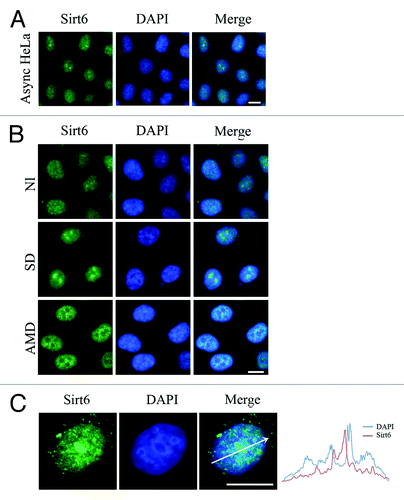
Figure 3. Nucleolar localization of Sirt6. (A) Based on the Sirt6 primary sequence, the Nucleolar Localization Sequence Detector predicted a NoLS in its C-terminus. (B) Overexpressed Sirt6ΔC, which lacks the last 35 residues, shows a partial localization to nucleus but is excluded from the nucleolus. (C) Sirt6 mutants, which mimic phosphorylated or dephosphorylated Sirt6, as well as the catalytically inactive form of Sirt6, can all translocate to nucleoli and are enriched in the nucleoli in the G1 phase. Scale bars, 10 µm.
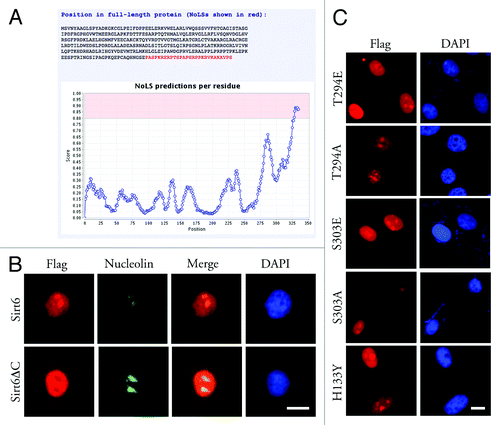
Figure 4. Antibodies against the Sirt6 C-terminus or C-terminal tags cannot detect nucleolar Sirt6. (A) In G1-arrested cells, antibodies against the Sirt6 N-terminus (Sigma) (upper row) and against a middle region of Sirt6 (middle row) show a nucleoplasmic signal and a strong nucleolar signal. Meanwhile, the antibody against the C-terminus (Sigma) does not show a nucleolar signal, but instead shows a diffuse nucleoplasmic signal and a strong signal in the perinucleolar region (lower row). (B) When Sirt6 was tagged with FLAG at its N-terminus and HA at its C-terminus, the anti-FLAG antibody shows nucleolar Sirt6, while anti-HA is not detectable in the nucleolus (upper row). Anti-FLAG also cannot detect any Sirt6 when the tag is at the C-terminus (lower row). Scale bars, 10 µm.
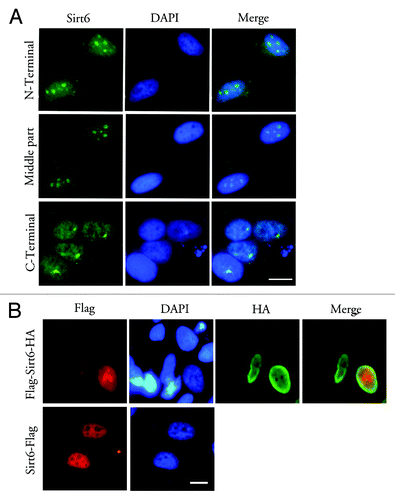
Figure 5. Sirt6 is enriched in the nucleolus in the G1 phase of the cell cycle. (A) Distribution of Sirt6 in the nucleus. Comparison with nucleolin and DAPI shows that Sirt6 is enriched in the nucleolus during the G1 phase of the cell cycle. In S phase, the nucleolus is almost free of Sirt6. The framed cells in the panels of the third column were analyzed, as shown in the photomicrographs in the last column, and the quantitative results are shown on the right. Scale bars, 10 µm. (B) Endogenous Sirt6 is also enriched in the nucleolus in G1, while in S phase, the Sirt6 signal is stronger in the nucleoplasm than in the nucleolus. (C) Immunoperoxidase electron microscopy of G1-arrested HeLa cells using anti-Sirt6 confirms nucleolar Sirt6 and shows that it is mostly in GCs (a). Panel b shows the negative control staining with no primary antibody. N, nucleus; Nucl, nucleolus; F, fibrillar center; D, dense fibrillar component; G, granular component. Scale bars, 1 µm.
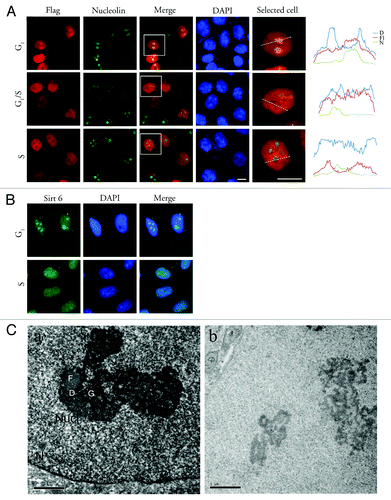
Figure 6. Sirt6 localization and expression level in mitosis. (A) In mitosis, endogenous Sirt6 localizes to the cytoplasm, partially co-localizes with mitotic spindles, and does not associate with condensed chromatin. In telophase, Sirt6 co-localizes with the nuclei of new cells. (B) Immunostaining of mitotic HeLa cells shows a stronger signal for endogenous Sirt6 compared with the signal in neighboring cells (left panel) in interphase (p < 0.0001, Student’s t-test). This difference was also significant when cells in each mitotic step of prophase/prometaphase, metaphase, anaphase and telophase were compared with interphase cells separately (p < 0.0001). The Sirt6 signal intensity in metaphase was significantly higher than in prophase/prometaphase and telophase (p < 0.005). (C) Immunoblotting also showed a higher level of endogenous Sirt6 in mitotic cells than in asynchronous Hela cells and cells arrested in G1, S or G2. Scale bars, 10 µm.
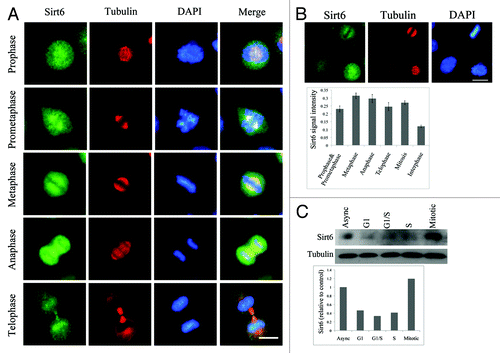
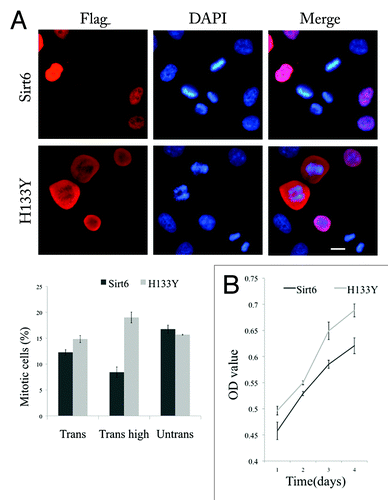
Figure 7. Sirt6 delays host cell mitosis. (A) The left panel shows that 12 h after transfected cells were synchronized in early S phase, the percentage of transfected cells that were in mitosis was much less for Sirt6 than for the nonfunctional Sirt6 mutant (H133Y). The difference is significant (Trans) (p = 0.02), especially when we compared the mitotic cell percentage in cells expressing Sirt6 or the mutant at a high level (Trans high) (p < 0.005). The percentage of mitotic cells in neighboring untransfected cells was not different between the two groups (Untrans). (B) An MTT assay shows a lower proliferation rate in Sirt6-overexpressing cells compared with cells overexpressing the Sirt6 mutant. Scale bar, 10 µm.
