977
Views
20
CrossRef citations to date
0
Altmetric
Extra View

Telomeres, tethers and trypanosomes

, , , &
Pages 478-486 | Published online: 19 Sep 2012

Figures & data

Figure 1. Evolutionary histories of known nuclear envelope components. (A) Cartoon of structures at, and associated with, the nuclear envelope. Shown are the nuclear pore complex/karyopherins (red), Sun/Kash (LINC complex) proteins (blue) and known components of a nuclear lamina (lamins, green; NUP-1, yellow). (B) The evolutionry distributions of the nuclear pore complex/karyopherins, Sun/Kash proteins and known nuclear lamina proteins are shown colorized and overlaid upon a schematic phylogeny of the eukaryotes, emphasizing the five contemporary-recognized supergroups. FECA, First eukaryotic common ancestor; LECA, Last eukaryotic common ancestor; KAP, karyopherin; SAR + CCTH, stramenopiles alveolates, and Rhizaria + cryptomonads, centrohelids, telonemids and haptophytes.
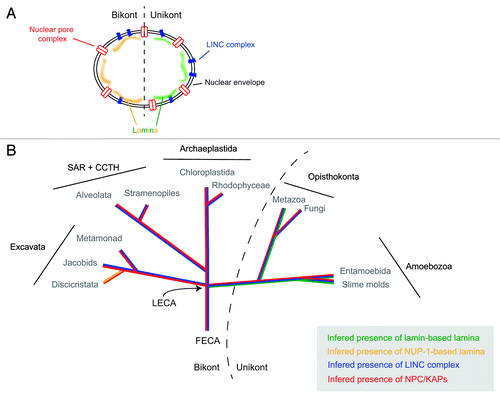
Figure 1. Evolutionary histories of known nuclear envelope components. (A) Cartoon of structures at, and associated with, the nuclear envelope. Shown are the nuclear pore complex/karyopherins (red), Sun/Kash (LINC complex) proteins (blue) and known components of a nuclear lamina (lamins, green; NUP-1, yellow). (B) The evolutionry distributions of the nuclear pore complex/karyopherins, Sun/Kash proteins and known nuclear lamina proteins are shown colorized and overlaid upon a schematic phylogeny of the eukaryotes, emphasizing the five contemporary-recognized supergroups. FECA, First eukaryotic common ancestor; LECA, Last eukaryotic common ancestor; KAP, karyopherin; SAR + CCTH, stramenopiles alveolates, and Rhizaria + cryptomonads, centrohelids, telonemids and haptophytes.

Figure 2. Relative sizes of metazoan and trypanosomatid nuclei and lamina monomers. Blue ovals indicate the relative sizes of a fibroblast and trypanosome nucleus, at 10 μm and 1.5 μm in diameter. The molecular weight of the unikont lamins is approximately 60 kDa while NUP-1 is 450 kDa; these are indicated as white bars close to the indicator lines for each nucleus. The inference is that the structural arrangement of the lamina in these systems is potentially very different.
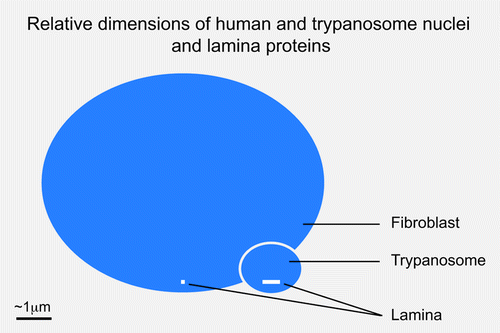
Figure 2. Relative sizes of metazoan and trypanosomatid nuclei and lamina monomers. Blue ovals indicate the relative sizes of a fibroblast and trypanosome nucleus, at 10 μm and 1.5 μm in diameter. The molecular weight of the unikont lamins is approximately 60 kDa while NUP-1 is 450 kDa; these are indicated as white bars close to the indicator lines for each nucleus. The inference is that the structural arrangement of the lamina in these systems is potentially very different.

Figure 3. Maximum likelihood phylogenetic tree of the SUN domains. The values supporting the separation into two main subfamilies are: approximate likelihood ratio test calculated with PhyML 3.0/non-parametric bootstrap calculated in RAxML 7.2.6/posterior probabilities from PhyloBayes 3.3b. The right panel depicts the domain structures of SUN-domain containing proteins of the representative species used in the phylogenetic analyses. Position of the SUN domain is symbolized by the blue box. Red rectangles represent hydrophobic patches predicted as transmembrane domains by TMHMM Server v. 2.0. Dashed red rectangles represent hydrophobic patches, which were not predicted as transmembrane domains. Red taxa are species where considerable characterization of the SUN proteins has been achieved.
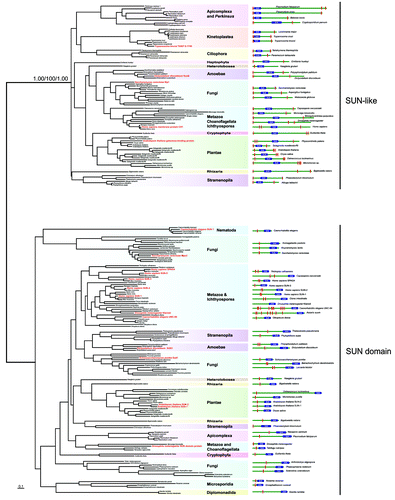
Figure 3. Maximum likelihood phylogenetic tree of the SUN domains. The values supporting the separation into two main subfamilies are: approximate likelihood ratio test calculated with PhyML 3.0/non-parametric bootstrap calculated in RAxML 7.2.6/posterior probabilities from PhyloBayes 3.3b. The right panel depicts the domain structures of SUN-domain containing proteins of the representative species used in the phylogenetic analyses. Position of the SUN domain is symbolized by the blue box. Red rectangles represent hydrophobic patches predicted as transmembrane domains by TMHMM Server v. 2.0. Dashed red rectangles represent hydrophobic patches, which were not predicted as transmembrane domains. Red taxa are species where considerable characterization of the SUN proteins has been achieved.