2,551
Views
156
CrossRef citations to date
0
Altmetric
Research Paper

The nuclear envelope proteome differs notably between tissues

, , , , , , , , , & show all
Pages 552-564 | Published online: 18 Sep 2012

Figures & data

Figure 1. Liver NE preparations. (A) NEs were isolated from rat liver by first dounce homogenization of the tissue to release nuclei, followed by separation of many contaminating membranes on sucrose gradients and finally digestion and washing away chromatin. These were further extracted with salt and detergent or NaOH to enrich respectively for proteins associated with the insoluble lamin polymer or proteins embedded in the membrane. (B-D) Electron micrographs of NE preparations. Arrowheads point to places where NPCs are inserted in the membrane. Note that images are taken at the step prior to extraction as no discernible structure was left after NaOH or salt and detergent extraction. Thus much cleaner NEs were subject to mass spectrometry analysis. Scale bar 200 nm. (B) Double membrane from particularly clean NE. (C) Most NEs had still chromatin connected. (D) Contaminants were also observed stuck to NEs such as the fragmented mitochondria shown. (E-F) NEs from the pre-extraction stage were analyzed by western blot for expected contaminants. (E) A microsome fraction was separately isolated from the post-nuclear supernatant and similar amounts of total protein loaded. NE proteins lamin A/C and LAP2β were not present in the microsome fraction while the ER marker calreticulin was highly enriched in the microsome fraction compared with the NE fraction. As the ONM is continuous with the ER, the low calreticulin signal in the NE fraction is expected. (F) A mitochondria fraction was isolated by pelleting at 11,000 x g from the post-nuclear supernatant. The mitochondrial marker porin was undetectable in NEs at the level of sensitivity of the LICOR for fluorescence detection, even when 20x more NEs were loaded.
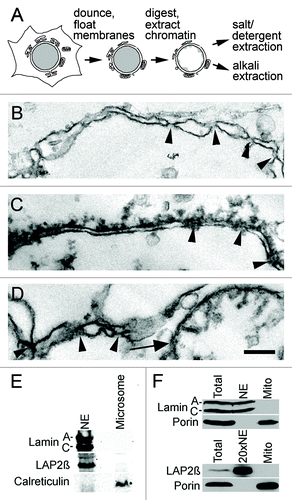
Figure 1. Liver NE preparations. (A) NEs were isolated from rat liver by first dounce homogenization of the tissue to release nuclei, followed by separation of many contaminating membranes on sucrose gradients and finally digestion and washing away chromatin. These were further extracted with salt and detergent or NaOH to enrich respectively for proteins associated with the insoluble lamin polymer or proteins embedded in the membrane. (B-D) Electron micrographs of NE preparations. Arrowheads point to places where NPCs are inserted in the membrane. Note that images are taken at the step prior to extraction as no discernible structure was left after NaOH or salt and detergent extraction. Thus much cleaner NEs were subject to mass spectrometry analysis. Scale bar 200 nm. (B) Double membrane from particularly clean NE. (C) Most NEs had still chromatin connected. (D) Contaminants were also observed stuck to NEs such as the fragmented mitochondria shown. (E-F) NEs from the pre-extraction stage were analyzed by western blot for expected contaminants. (E) A microsome fraction was separately isolated from the post-nuclear supernatant and similar amounts of total protein loaded. NE proteins lamin A/C and LAP2β were not present in the microsome fraction while the ER marker calreticulin was highly enriched in the microsome fraction compared with the NE fraction. As the ONM is continuous with the ER, the low calreticulin signal in the NE fraction is expected. (F) A mitochondria fraction was isolated by pelleting at 11,000 x g from the post-nuclear supernatant. The mitochondrial marker porin was undetectable in NEs at the level of sensitivity of the LICOR for fluorescence detection, even when 20x more NEs were loaded.

Figure 2. Comparison of replicate MudPIT runs. (A) Both the process of separately analyzing alkali and salt/ detergent extracted NEs and the sequential protease digestions increased the recovery of proteins, particularly NETs. Proportional venn diagrams are shown for the transmembrane proteins identified in all the NaOH or salt/detergent extracted samples and for those identified in all trypsin alone or trypsin followed by proteinase K runs. (B) The same complex sample equally divided yields differences in the identifications for each MudPIT run. However, as the number of runs increases fewer new unique proteins are identified such that the curve plateaus with roughly five replicates. In this experiment liver NEs extracted with 400 mM NaCl, 1% β-octylglucoside were digested with trypsin, insoluble material pelleted and digested with PK. The trypsin sample was split into four equal samples and the PK material into two equal samples and all six samples were separately run on the mass spectrometer.
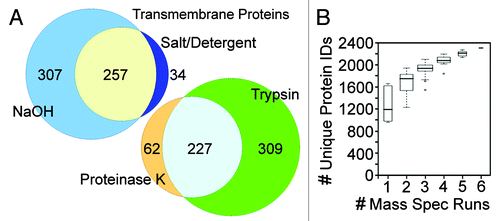
Figure 2. Comparison of replicate MudPIT runs. (A) Both the process of separately analyzing alkali and salt/ detergent extracted NEs and the sequential protease digestions increased the recovery of proteins, particularly NETs. Proportional venn diagrams are shown for the transmembrane proteins identified in all the NaOH or salt/detergent extracted samples and for those identified in all trypsin alone or trypsin followed by proteinase K runs. (B) The same complex sample equally divided yields differences in the identifications for each MudPIT run. However, as the number of runs increases fewer new unique proteins are identified such that the curve plateaus with roughly five replicates. In this experiment liver NEs extracted with 400 mM NaCl, 1% β-octylglucoside were digested with trypsin, insoluble material pelleted and digested with PK. The trypsin sample was split into four equal samples and the PK material into two equal samples and all six samples were separately run on the mass spectrometer.

Figure 3. Global analysis of NE tissue differences. (A) All proteins identified in all tissues are plotted in the heatmap with TM proteins on the left and soluble proteins on the right. Color-coding is for log-transformed dNSAF values, indicating the relative abundance within a particular tissue with red meaning high abundance and blue low abundance. Raw dNSAF values are given in Table S3. Black indicates absence from a particular data set. The PHA-activated blood leukocyte data set was used, but results are indistinguishable from the separate unstimulated blood leukocyte data set. The differences between tissues and the lack of a correlation between abundance in a tissue and overall abundance further support the tissue specificity. (B) The percent identity between mouse, rat and human homologs was calculated for all NE proteins and the distribution is plotted using variable width Tukey boxplots according to the number of tissues in which each protein was found. The proteins found in all three tissues were significantly more conserved in sequence than the proteins found in just one (Kolmogorov-Smirnov test: D = 0.1547, p value 4.0 x 10⁻¹⁵). (C) NE proteins that were identified in at least 60% of runs compared with data from the BioGPS transcriptome database. Proteins identified in different tissues were color-coded: PHA-activated human blood leukocytes (red), rat muscle (yellow), rat liver (blue), PHA-activated blood leukocytes and muscle (orange), PHA-activated blood leukocytes and liver (purple), muscle and liver (green), all three tissues (brown). These were then plotted according to their level of expression in the different tissues such that those more specifically expressed in human blood, muscle or liver respectively climb along the x-, y- and z-axis. Note that the BioGPS transcriptome database did not have a separate leukocyte-enriched population similar to that used for the proteomic analysis; therefore, whole blood was used for the comparison because expression in this tissue should encompass all the proteins identified in the more restricted blood leukocyte NE data sets.
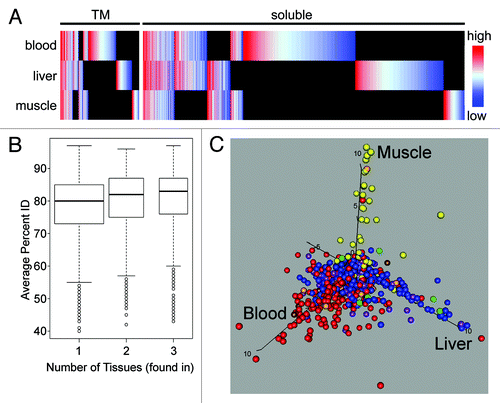
Figure 3. Global analysis of NE tissue differences. (A) All proteins identified in all tissues are plotted in the heatmap with TM proteins on the left and soluble proteins on the right. Color-coding is for log-transformed dNSAF values, indicating the relative abundance within a particular tissue with red meaning high abundance and blue low abundance. Raw dNSAF values are given in Table S3. Black indicates absence from a particular data set. The PHA-activated blood leukocyte data set was used, but results are indistinguishable from the separate unstimulated blood leukocyte data set. The differences between tissues and the lack of a correlation between abundance in a tissue and overall abundance further support the tissue specificity. (B) The percent identity between mouse, rat and human homologs was calculated for all NE proteins and the distribution is plotted using variable width Tukey boxplots according to the number of tissues in which each protein was found. The proteins found in all three tissues were significantly more conserved in sequence than the proteins found in just one (Kolmogorov-Smirnov test: D = 0.1547, p value 4.0 x 10⁻¹⁵). (C) NE proteins that were identified in at least 60% of runs compared with data from the BioGPS transcriptome database. Proteins identified in different tissues were color-coded: PHA-activated human blood leukocytes (red), rat muscle (yellow), rat liver (blue), PHA-activated blood leukocytes and muscle (orange), PHA-activated blood leukocytes and liver (purple), muscle and liver (green), all three tissues (brown). These were then plotted according to their level of expression in the different tissues such that those more specifically expressed in human blood, muscle or liver respectively climb along the x-, y- and z-axis. Note that the BioGPS transcriptome database did not have a separate leukocyte-enriched population similar to that used for the proteomic analysis; therefore, whole blood was used for the comparison because expression in this tissue should encompass all the proteins identified in the more restricted blood leukocyte NE data sets.

Figure 4. NE tissue distinctiveness. (A) Numbers of NETs overlapping between rat liver, rat muscle and human PHA-stimulated blood leukocytes expressed using a proportional Venn diagram. For this analysis PHA-stimulated blood leukocytes were considered separately from the leukocytes that were not stimulated (hence fewer than the 1,037 total NETs identified). This was done because protein differences between the two conditions render them almost like separate tissuesCitation9; however, results were similar when comparing either blood leukocyte data set with the other tissues. (B) The small amount of overlap between tissues for the NE proteome is maintained for higher stringency protein subsets. Plotting the percentage of proteins shared between all three tissues yields a value ~10% that is maintained when considering higher stringency subsets: NET, transmembrane proteins; 5x, 5-fold enriched over microsomes by abundance estimates (dNSAF); Multi, appeared in multiple MudPIT runs for the same tissue. (C) Proportional Venn diagram of transmembrane proteins found in NE data sets that had GO-targeting annotations associated with other organelles. As in A, just the PHA-stimulated blood leukocytes are shown for the comparison. Many more proteins were identified in multiple tissues among this set compared with the total set of NETs shown in . (D) The percentage of total proteins in a particular NE tissue data set that have GO-targeting annotations for each organelle is plotted by each contaminating organelle (cyto-mbv is cytoplasmic membrane bound vesicles). Most organelles represented less than 3% contamination of any NE preparation. Moreover, the amount was similar for proteins identified in individual or multiple NE tissue data sets. Only mitochondria and ER GO-targeting annotated proteins were found more commonly in all NE data sets. Standard deviations are shown. Note that the error bar for mitochondria contaminants in 2-tissues goes above the graph scale: the standard deviation value is 10.96.
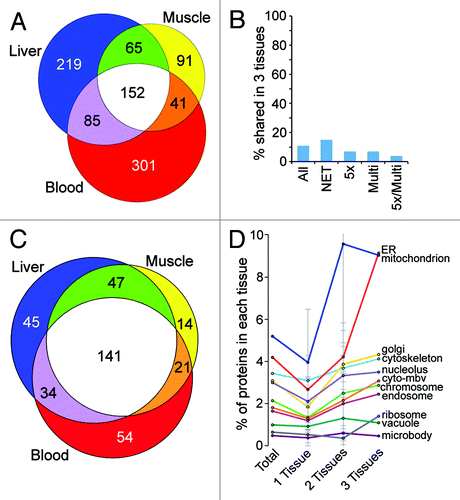
Figure 4. NE tissue distinctiveness. (A) Numbers of NETs overlapping between rat liver, rat muscle and human PHA-stimulated blood leukocytes expressed using a proportional Venn diagram. For this analysis PHA-stimulated blood leukocytes were considered separately from the leukocytes that were not stimulated (hence fewer than the 1,037 total NETs identified). This was done because protein differences between the two conditions render them almost like separate tissuesCitation9; however, results were similar when comparing either blood leukocyte data set with the other tissues. (B) The small amount of overlap between tissues for the NE proteome is maintained for higher stringency protein subsets. Plotting the percentage of proteins shared between all three tissues yields a value ~10% that is maintained when considering higher stringency subsets: NET, transmembrane proteins; 5x, 5-fold enriched over microsomes by abundance estimates (dNSAF); Multi, appeared in multiple MudPIT runs for the same tissue. (C) Proportional Venn diagram of transmembrane proteins found in NE data sets that had GO-targeting annotations associated with other organelles. As in A, just the PHA-stimulated blood leukocytes are shown for the comparison. Many more proteins were identified in multiple tissues among this set compared with the total set of NETs shown in Figure 3A. (D) The percentage of total proteins in a particular NE tissue data set that have GO-targeting annotations for each organelle is plotted by each contaminating organelle (cyto-mbv is cytoplasmic membrane bound vesicles). Most organelles represented less than 3% contamination of any NE preparation. Moreover, the amount was similar for proteins identified in individual or multiple NE tissue data sets. Only mitochondria and ER GO-targeting annotated proteins were found more commonly in all NE data sets. Standard deviations are shown. Note that the error bar for mitochondria contaminants in 2-tissues goes above the graph scale: the standard deviation value is 10.96.

Figure 5. Experimental confirmation of NET tissue-specificity. (A) RT-PCR from human tissue RNA confirms that several of the NETs identified by MudPIT in a particular tissue have messages preferentially transcribed in that tissue and often absent from a subset of other tissues. NETs shown are grouped according to the tissue of highest expression (muscle, liver or blood leukocytes), but some were found in multiple data sets. Peptidylprolyl isomerase A (PPIA) was used as a loading control. (B) Protein tissue specificity assessed by western blot. Equal amounts of protein from lysates of rat liver, heart, muscle and thymus were compared on the same blots for the levels of different NETs. NET levels were quantified using fluorescently labeled secondary antibodies using a LI-COR system. The total signal for all four tissues was calculated and the fraction of the total signal in each tissue is colored in the plot. The average values from three blots are shown. (C) Cryosections of rat heart or leg muscle, liver and spleen were stained with NET antibodies. Nuclear rim staining was only observed in the tissue where the NET was identified by proteomics: C17orf62 was more abundant in blood leukocytes, but identified in all tissues. Sometimes cytoplasmic staining was also observed, consistent with NETs occupying multiple cellular locations; however, most of the appearance of NETs in the cytoplasm in other tissues comes from increasing exposure times in order to see the background. Bars 10 µm.
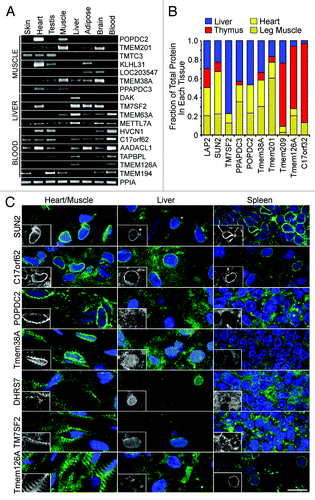
Figure 5. Experimental confirmation of NET tissue-specificity. (A) RT-PCR from human tissue RNA confirms that several of the NETs identified by MudPIT in a particular tissue have messages preferentially transcribed in that tissue and often absent from a subset of other tissues. NETs shown are grouped according to the tissue of highest expression (muscle, liver or blood leukocytes), but some were found in multiple data sets. Peptidylprolyl isomerase A (PPIA) was used as a loading control. (B) Protein tissue specificity assessed by western blot. Equal amounts of protein from lysates of rat liver, heart, muscle and thymus were compared on the same blots for the levels of different NETs. NET levels were quantified using fluorescently labeled secondary antibodies using a LI-COR system. The total signal for all four tissues was calculated and the fraction of the total signal in each tissue is colored in the plot. The average values from three blots are shown. (C) Cryosections of rat heart or leg muscle, liver and spleen were stained with NET antibodies. Nuclear rim staining was only observed in the tissue where the NET was identified by proteomics: C17orf62 was more abundant in blood leukocytes, but identified in all tissues. Sometimes cytoplasmic staining was also observed, consistent with NETs occupying multiple cellular locations; however, most of the appearance of NETs in the cytoplasm in other tissues comes from increasing exposure times in order to see the background. Bars 10 µm.

Figure 6. Differences in NE functional composition in different tissues. (A) Proteins identified in at least 60% of runs for a particular NE fraction were searched for their inclusion in the Johns Hopkins HPRD database of annotated protein complexes and then for each complex the proportion of complex components found in each tissue was calculated. Data are shown for the 352 complexes for which at least 75% of components were found in the data sets and the percentage for each tissue is plotted additively with liver in blue, muscle in yellow and blood leukocytes in red. The maximum proportion for any individual complex is 1; therefore a complex fully intact in all three tissues would have a value of 3. For many complexes all components were found in only one or two of the tissues. (B) The percentage of complex components found in each tissue is similarly plotted, but restricted to those complexes containing a NET. (C-F) Within the subset of proteins in NE data sets with GO-annotations, the fraction with a particular functional annotation was calculated. Similar fractions were calculated against all “nuclear”-annotated proteins in the GO-database. The relative ratio of NE/nuclear fractions was then calculated, setting a 1:1 ratio to 0 so that positive values are fold-relative enrichment and negative are fold-relative deficiency at the NE compared with the whole nucleus. Relative enrichment thus indicates a function that is more enriched at the NE compared with other functions associated with the nucleus as opposed to indicating a concentration at the NE. Liver, muscle and unstimulated and activated blood leukocyte data sets are represented by blue, yellow, pink and red bars, respectively. (C) General functions such as nuclear transport, signaling and ion transport were relatively enriched at the periphery. (D) More specific RNA functions revealed some tissue differences in relative NE enrichment. (E) Certain epigenetic functions were relatively enriched at the NE in particular tissues. (F) Some signaling functions were relatively enriched at the NE in certain tissues. For example, Wnt signaling was relatively enriched at the NE in liver while being strongly deficient at the NE in unstimulated blood leukocytes.
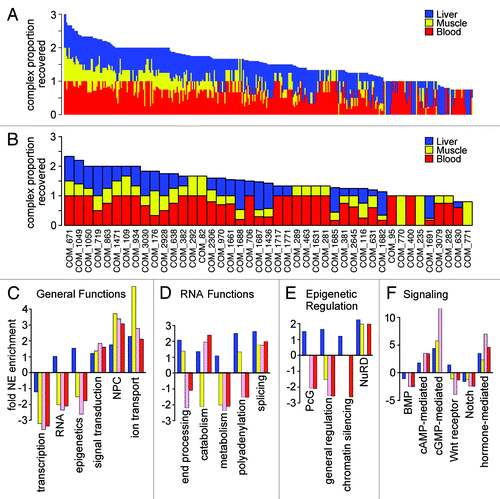
Figure 6. Differences in NE functional composition in different tissues. (A) Proteins identified in at least 60% of runs for a particular NE fraction were searched for their inclusion in the Johns Hopkins HPRD database of annotated protein complexes and then for each complex the proportion of complex components found in each tissue was calculated. Data are shown for the 352 complexes for which at least 75% of components were found in the data sets and the percentage for each tissue is plotted additively with liver in blue, muscle in yellow and blood leukocytes in red. The maximum proportion for any individual complex is 1; therefore a complex fully intact in all three tissues would have a value of 3. For many complexes all components were found in only one or two of the tissues. (B) The percentage of complex components found in each tissue is similarly plotted, but restricted to those complexes containing a NET. (C-F) Within the subset of proteins in NE data sets with GO-annotations, the fraction with a particular functional annotation was calculated. Similar fractions were calculated against all “nuclear”-annotated proteins in the GO-database. The relative ratio of NE/nuclear fractions was then calculated, setting a 1:1 ratio to 0 so that positive values are fold-relative enrichment and negative are fold-relative deficiency at the NE compared with the whole nucleus. Relative enrichment thus indicates a function that is more enriched at the NE compared with other functions associated with the nucleus as opposed to indicating a concentration at the NE. Liver, muscle and unstimulated and activated blood leukocyte data sets are represented by blue, yellow, pink and red bars, respectively. (C) General functions such as nuclear transport, signaling and ion transport were relatively enriched at the periphery. (D) More specific RNA functions revealed some tissue differences in relative NE enrichment. (E) Certain epigenetic functions were relatively enriched at the NE in particular tissues. (F) Some signaling functions were relatively enriched at the NE in certain tissues. For example, Wnt signaling was relatively enriched at the NE in liver while being strongly deficient at the NE in unstimulated blood leukocytes.
Supplemental material

Additional material

Download Zip (31.8 MB)