617
Views
10
CrossRef citations to date
0
Altmetric
Research Paper

5-Carboxylcytosine is localized to euchromatic regions in the nuclei of follicular cells in axolotl ovary

, , , , &
Pages 565-569 | Published online: 01 Nov 2012

Figures & data

Figure 1. 5-Carboxylcytosine is immunochemically detectable in the somatic cells of axolotl ovary. (A) 5-hmC and 5-caC immunostaining of young adult axolotl ovary and neural tube tissue (indicated). Developing follicle is marked with white and cell-nest with yellow arrows. (B) Immunohistochemical detection of 5-hmC and 5-caC in axolotl ovary and surrounding tissues. Immunostaining for 5-hmC, 5-caC, DAPI and 5-hmC/5-caC merge views are shown. The morphological border of ovarian theca is marked with a dotted line. Examples of non-specific (non-nuclear) staining produced by anti-5-caC antibody in ovarian theca are marked with white arrow. Scale bars are 20 μm.
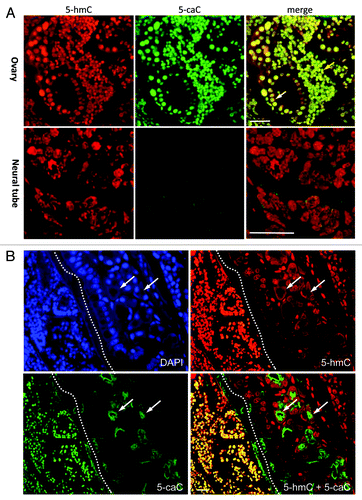
Figure 1. 5-Carboxylcytosine is immunochemically detectable in the somatic cells of axolotl ovary. (A) 5-hmC and 5-caC immunostaining of young adult axolotl ovary and neural tube tissue (indicated). Developing follicle is marked with white and cell-nest with yellow arrows. (B) Immunohistochemical detection of 5-hmC and 5-caC in axolotl ovary and surrounding tissues. Immunostaining for 5-hmC, 5-caC, DAPI and 5-hmC/5-caC merge views are shown. The morphological border of ovarian theca is marked with a dotted line. Examples of non-specific (non-nuclear) staining produced by anti-5-caC antibody in ovarian theca are marked with white arrow. Scale bars are 20 μm.

Figure 2. Both 5-hydroxymethylcytosine and 5-carboxylcytosine are distributed to the euchromatic regions in the nuclei of axolotl follicular cells. (A) Confocal image of a representative field of axolotl ovary stained with 5-hmC, 5-caC and DAPI. Merge view is shown. An inset shows the cells used for the analysis presented in (B-E) under higher magnification. Scale bar is 10 μm. (B-E) 2.5XD plot of 5-hmC, 5-caC and DAPI signal intensities of the inset in (A). Merge view (B) and single channel images (C, D and E) are shown.
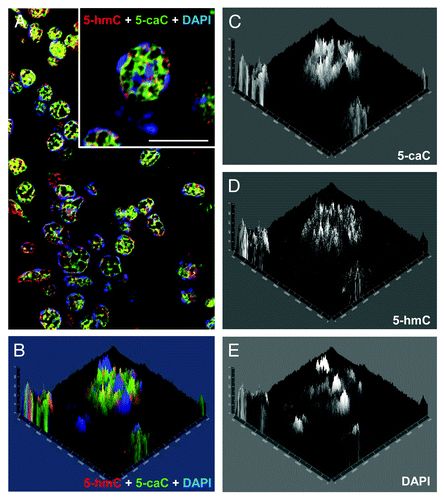
Figure 2. Both 5-hydroxymethylcytosine and 5-carboxylcytosine are distributed to the euchromatic regions in the nuclei of axolotl follicular cells. (A) Confocal image of a representative field of axolotl ovary stained with 5-hmC, 5-caC and DAPI. Merge view is shown. An inset shows the cells used for the analysis presented in (B-E) under higher magnification. Scale bar is 10 μm. (B-E) 2.5XD plot of 5-hmC, 5-caC and DAPI signal intensities of the inset in (A). Merge view (B) and single channel images (C, D and E) are shown.

Figure 3. The patterns of nuclear distribution of 5-hydroxymethylcytosine and 5-carboxylcytosine are similar but not identical. (A) Immunochemical detection of 5-hmC and 5-caC in a single nucleus of axolotl follicular cell co-stained with DAPI using confocal microscopy. Merge view and single channel images (indicated) are shown. The position of the region used for the generation of the signal intensities profile plot shown in (B) is marked with a dashed arrow. (B) The profile of DAPI, 5-hmC and 5-caC signal intensities (indicated) across heterochromatic and euchromatic regions of the follicular cell nucleus presented in (A).
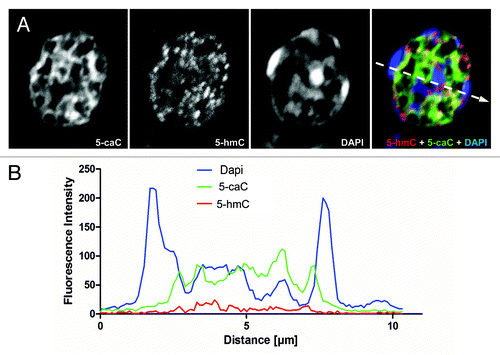
Figure 3. The patterns of nuclear distribution of 5-hydroxymethylcytosine and 5-carboxylcytosine are similar but not identical. (A) Immunochemical detection of 5-hmC and 5-caC in a single nucleus of axolotl follicular cell co-stained with DAPI using confocal microscopy. Merge view and single channel images (indicated) are shown. The position of the region used for the generation of the signal intensities profile plot shown in (B) is marked with a dashed arrow. (B) The profile of DAPI, 5-hmC and 5-caC signal intensities (indicated) across heterochromatic and euchromatic regions of the follicular cell nucleus presented in (A).
Supplemental material

Additional material

Download Zip (50.5 KB)