Figures & data
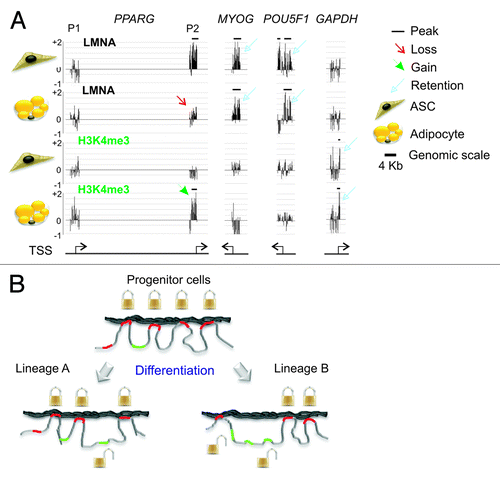
Figure 1. The nuclear lamina interacts with the genome through lamina-associated domains or LADs. The nuclear envelope consists of an outer and inner nuclear membrane (ONM and INM respectively) under laid by the lamina. LADs largely consist of inactive chromatin region and are bordered by CTCF proteins. Active loci preferentially locate outside LADs.
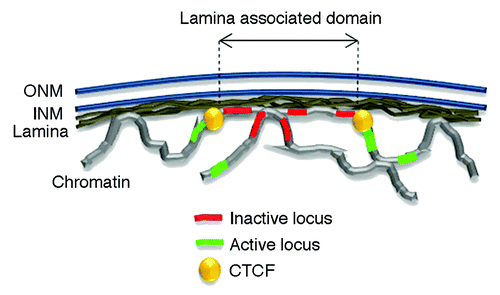
Figure 2. Genes with a promoter interacting with LMNA form clusters in the genome. (A) Chromosome distribution of LMNA enrichment determined by the ratio of LMNA-interacting genes to all genes per chromosome. Red bars indicate LMNA enrichment, and blue bars indicate LMNA impoverishment, both relative to genome-average LMNA occupancy (Genome; **P < 10−4; *P < 10−2; Chi-square). The data are from our laboratory (Lund EG and Collas P, unpublished). (B) Genes with a promoter enriched in lamin A cluster into “lamin-rich domains”.Citation22 Graph shows LMNA enrichment in 31-gene windows across chromosomes 1, 16, and X in human ASCs, determined by ChiP. For comparison, domains of LMNB1 enrichment identified by DamIDCitation13 in lung fibroblasts are also shown.
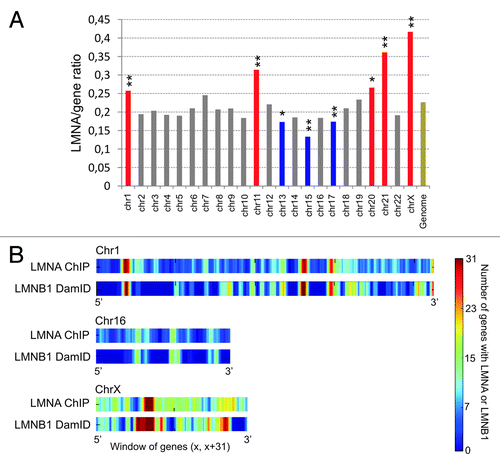
Figure 3. Genome-wide context of LMNA interaction with promoters shows association with a repressive environment. LMNA enrichment in a genomic ‘neighborhood’ affects the expression of genes associated with LMNA (black line) but not the expression of genes not interacting with LMNA in that neighborhood (dotted line; LMNA*). The data show regression lines and Spearman correlations (r). X-axis indicates ratios of genes with a given mark (LMNA, H3K4me3, H3K9me3, H3K27me3 or DNA methylation) to that of all genes in 1 Mb bins (bin data points are not shown). Y-axis indicates the ratios of expressed genes to all genes in a bin. A bin is assimilated to a ‘neighborhood’). Data for LMNA are from RefCitation22; data for chromatin modifications are from our laboratory (Lund EG and Collas P, unpublished data).
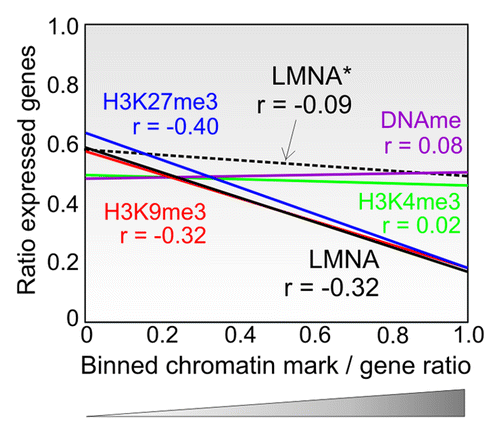
Figure 4. Topological landscape of LMNA on promoters. (A) LMNA peak density on promoter regions. Highest densities are found upstream-distal from the TSS, and in a TSS-downstream region. (B) Genes with a promoter bound to LMNA in the sub-regions defined from the density map fall into distinct gene ontology categories. (C) Distribution of LMNA peaks over 4 Kb of promoter regions in adipose stem cells. Promoters with a LMNA peak spanning the 5′ end of tiled regions or entirely contained within the tile regions are the most frequent. Numbers of genes in each cluster are shown (Lund EG and Collas P, unpublished).
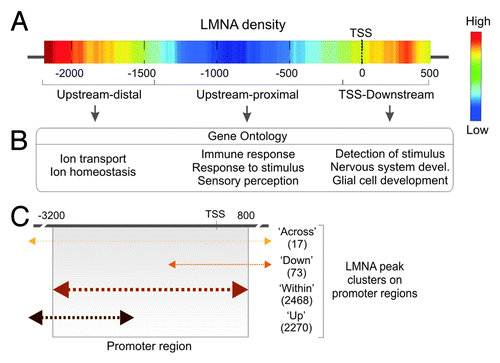
Figure 5. Positioning of lamin A on promoters correlates with the expression output of the corresponding gene. (A) LMNA positioning over the TSS or downstream, of proximal upstream of the TSS, is associated with absence of expression, whereas localization upstream-distal is permissive. Note that the high-low scale is different for LMNA and expression heat maps in that despite transcriptional permissiveness, the frequency of expressed genes with LMNA upstream-distal of the TSS remains low. (B) Schematic representation of the relationship between LMNA positioning and gene expression. The permissive state is detailed on the right (box) and depends on the associated histone modification.
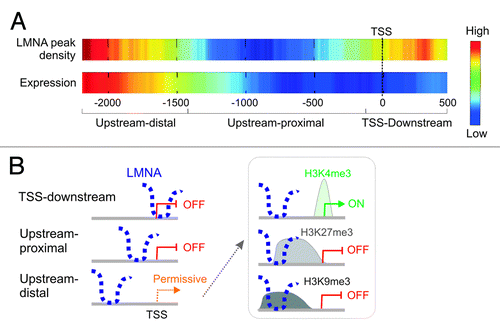
Figure 6. Lineage-specific unlocking genes for transcriptional activation. (A) Examples of the lineage-specificity of the dissociation of promoters from the lamina (here, LMNA) and acquisition of H3K4me3, upon differentiation of adipocyte progenitors (ASCs) into adipocytes. The P2 promoter (but not P1) of the PPARG gene, which is activated after adipogenic induction, displays a loss of LMNA peak (enrichment) in adipocytes (red arrow), and gains an H3K4me3 peak (green arrowhead). In contrast, promoters of the myogenic gene MYOG and of the pluripotency gene POU5F1 retain LMNA peaks (blue arrows) and do not acquire H3K4me3. GAPDH, which is expressed in both ASCs and adipocytes, is not associated with LMNA and displays a peak of H3K4me3 in both cell types (blue closed arrows). Horizontal bars indicate the presence and position of peaks of LMNA or H3K4me3 enrichment on promoters. (B) Working model of the lineage specificity of gene unlocking from LMNA during differentiation of progenitor cells into distinct lineages. Genes required for differentiation into a given lineage “A” or “B” and which interact with LMNA in progenitor cells (e.g., mesenchymal stem cells) become “unlocked”, while those that are not required for differentiation remain associated with LMNA.