2,141
Views
21
CrossRef citations to date
0
Altmetric
Research Paper

Nuclear localization signal deletion mutants of lamin A and progerin reveal insights into lamin A processing and emerin targeting

, , , &
Pages 66-74 | Received 13 Dec 2013, Accepted 31 Jan 2014, Published online: 04 Feb 2014

Figures & data

Figure 1. Characterization of the NLS-deleted lamin A and progerin. (A) A schematic diagram of the generation of the NLS deletion mutants. Lamin A and progerin NLS deletion (LAΔNLS and PGΔNLS) were created via PCR and subcloned into the AscI and XbaI sites of the pEGFP-C1 plasmid. (B) Western Blot analysis. Protein samples were immunoblotted with antibodies of lamin A/C and β-actin. Non-transfected HeLa cells were used as a control (CT). (C) Confocal fluorescence images. HeLa cells transiently expressing EGFP-LA, EGFP-PG, EGFP-LAΔNLS or EGFP-PGΔNLS (green) were fixed and stained with anti-lamin B1 (red) by immunofluorescence at 24 h post transfection. DNA was stained with DAPI (blue). A representative cell under each condition is shown. Scale bar, 5 μm. (D) Confocal fluorescence images. HeLa cells transiently expressing EGFP-LAΔNLS or EGFP-PGΔNLS (green) were fixed and stained with anti-KDEL (a marker for ER, in red) or anti-GM130 (a marker for Golgi, in red). A representative cell under each condition is shown. Scale bar, 10 μm.
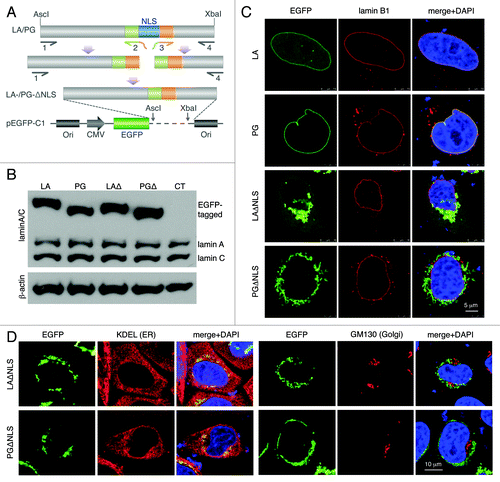
Figure 1. Characterization of the NLS-deleted lamin A and progerin. (A) A schematic diagram of the generation of the NLS deletion mutants. Lamin A and progerin NLS deletion (LAΔNLS and PGΔNLS) were created via PCR and subcloned into the AscI and XbaI sites of the pEGFP-C1 plasmid. (B) Western Blot analysis. Protein samples were immunoblotted with antibodies of lamin A/C and β-actin. Non-transfected HeLa cells were used as a control (CT). (C) Confocal fluorescence images. HeLa cells transiently expressing EGFP-LA, EGFP-PG, EGFP-LAΔNLS or EGFP-PGΔNLS (green) were fixed and stained with anti-lamin B1 (red) by immunofluorescence at 24 h post transfection. DNA was stained with DAPI (blue). A representative cell under each condition is shown. Scale bar, 5 μm. (D) Confocal fluorescence images. HeLa cells transiently expressing EGFP-LAΔNLS or EGFP-PGΔNLS (green) were fixed and stained with anti-KDEL (a marker for ER, in red) or anti-GM130 (a marker for Golgi, in red). A representative cell under each condition is shown. Scale bar, 10 μm.

Figure 2. C-terminal farnesyl group tethers LAΔNLS and PGΔNLS to the ER membrane. (A) Click chemistry analysis. HeLa cells were transfected with EGFP-LA, EGFP-PG, EGFP-LAΔNLS or EGFP-PGΔNLS and labeled with Click-iT farnesyl alcohol, followed by precipitation with GFP-Trap beads and detection with 647 Alkyne. Strong farnesylation signals appeared in PG and PGΔNLS (PGΔ) lanes, and weak but detectable farnsylation showed in LAΔNLS (LAΔ) lane. (B) Quantification of farnesylation levels in (A). The relative farnesylation level was calculated as the ratio of the farnesylation signal to the corresponding IP’ed protein signal. (C) Confocal fluorescence images of LAssimΔNLS and PGssimΔNLS. Immunofluorescence was performed 24 h after transfection. Confocal images show EGFP (green), lamin B1 (red), and DNA (blue). A representative cell under each condition is shown. Scale bar, 10 μm.
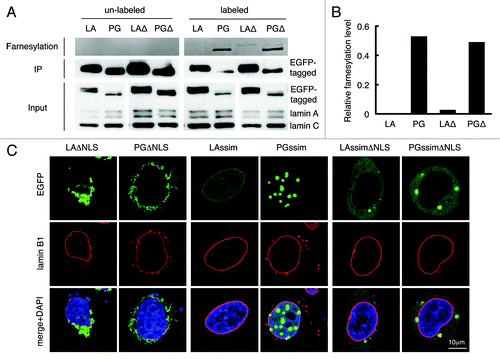
Figure 2. C-terminal farnesyl group tethers LAΔNLS and PGΔNLS to the ER membrane. (A) Click chemistry analysis. HeLa cells were transfected with EGFP-LA, EGFP-PG, EGFP-LAΔNLS or EGFP-PGΔNLS and labeled with Click-iT farnesyl alcohol, followed by precipitation with GFP-Trap beads and detection with 647 Alkyne. Strong farnesylation signals appeared in PG and PGΔNLS (PGΔ) lanes, and weak but detectable farnsylation showed in LAΔNLS (LAΔ) lane. (B) Quantification of farnesylation levels in (A). The relative farnesylation level was calculated as the ratio of the farnesylation signal to the corresponding IP’ed protein signal. (C) Confocal fluorescence images of LAssimΔNLS and PGssimΔNLS. Immunofluorescence was performed 24 h after transfection. Confocal images show EGFP (green), lamin B1 (red), and DNA (blue). A representative cell under each condition is shown. Scale bar, 10 μm.
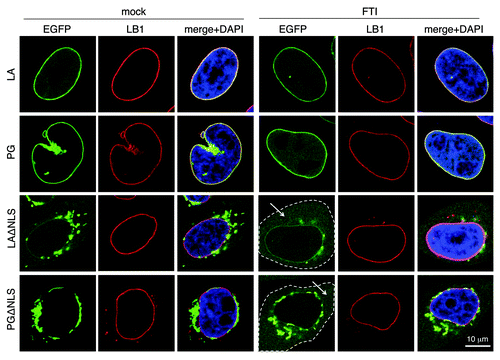
Figure 3. The effect of FTI treatment resembles that of LAssimΔNLS. FTI treatment was performed on HeLa cells at 4 h post-transfection for 16 h. The cytoplasm of the ΔNLS mutants transfected cells with FTI treatment are outlined by dashed lines. Soluble cytoplasmic EGFP signals are pointed by arrows. Confocal images show EGFP (green), lamin B1 (red), and DNA (blue). A representative cell under each condition is shown. Scale bar, 10 μm.

Figure 3. The effect of FTI treatment resembles that of LAssimΔNLS. FTI treatment was performed on HeLa cells at 4 h post-transfection for 16 h. The cytoplasm of the ΔNLS mutants transfected cells with FTI treatment are outlined by dashed lines. Soluble cytoplasmic EGFP signals are pointed by arrows. Confocal images show EGFP (green), lamin B1 (red), and DNA (blue). A representative cell under each condition is shown. Scale bar, 10 μm.

Figure 4. Disrupted emerin localization in cells expressing LAΔNLS or PGΔNLS. (A) Confocal fluorescence images. HeLa cells transiently expressing EGFP-LA, EGFP-PG, EGFP-LAΔNLS or EGFP-PGΔNLS (green) were fixed and stained with anti-emerin (red) at 24 h post transfection. A representative cell under each condition is shown. Scale bar, 10 μm. (B) IP with GFP-Trap®_A beads in the transfected HeLa cells. Un-transfected HeLa cells were used as a control (CT). (C) Relative intensity of emerin to EGFP-tagged proteins in each immunopricipitated sample. Band intensities were analyzed using ImageJ. Relative intensities were presented as the ratio of emerin to EGFP. Two biological duplicates were conducted. A representative experiment was shown.
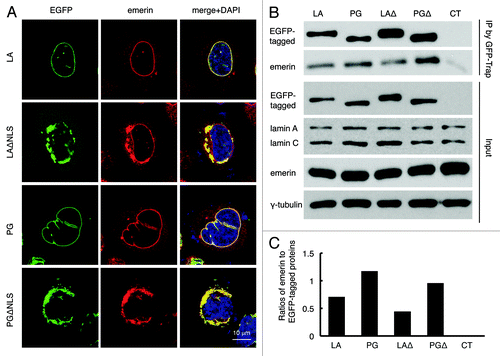
Figure 4. Disrupted emerin localization in cells expressing LAΔNLS or PGΔNLS. (A) Confocal fluorescence images. HeLa cells transiently expressing EGFP-LA, EGFP-PG, EGFP-LAΔNLS or EGFP-PGΔNLS (green) were fixed and stained with anti-emerin (red) at 24 h post transfection. A representative cell under each condition is shown. Scale bar, 10 μm. (B) IP with GFP-Trap®_A beads in the transfected HeLa cells. Un-transfected HeLa cells were used as a control (CT). (C) Relative intensity of emerin to EGFP-tagged proteins in each immunopricipitated sample. Band intensities were analyzed using ImageJ. Relative intensities were presented as the ratio of emerin to EGFP. Two biological duplicates were conducted. A representative experiment was shown.
Supplemental material

Additional material

Download Zip (612.5 KB)