Figures & data
Figure 1. H2B PALM localization inside the cellular nucleus. (A) Two-dimensional projection of a 3D PALM acquisition of tagged histone H2B. For each single-molecule detection, the number of neighbors has been calculated within a radius of 100 nm and per unit of volume; the resulting value was normalized by the total number of detections and a factor 1000 for numerical convenience. The color code therefore represents local density with the following units [ρN] = μm−3 × 10⁻³ counts. In the inset, a zoomed image displaying an intra-nuclear cluster. (B) Total number of H2B SM detections spatially re-distributed over complete spatial randomness (CSR) in the nuclear envelope. Here, the same representation procedure as in (A) was followed. (C) PALM image of histone H2B with local density estimated over a 1 µm radius, showing an enrichment of H2B at the edges of the nucleus. (D) Density map estimated over 50 nm wide annular regions defined by their distance to the nuclear membrane.
![Figure 1. H2B PALM localization inside the cellular nucleus. (A) Two-dimensional projection of a 3D PALM acquisition of tagged histone H2B. For each single-molecule detection, the number of neighbors has been calculated within a radius of 100 nm and per unit of volume; the resulting value was normalized by the total number of detections and a factor 1000 for numerical convenience. The color code therefore represents local density with the following units [ρN] = μm−3 × 10⁻³ counts. In the inset, a zoomed image displaying an intra-nuclear cluster. (B) Total number of H2B SM detections spatially re-distributed over complete spatial randomness (CSR) in the nuclear envelope. Here, the same representation procedure as in (A) was followed. (C) PALM image of histone H2B with local density estimated over a 1 µm radius, showing an enrichment of H2B at the edges of the nucleus. (D) Density map estimated over 50 nm wide annular regions defined by their distance to the nuclear membrane.](/cms/asset/47f80bff-c309-4ab1-9e22-763f598b9c12/kncl_a_10928227_f0001.gif)
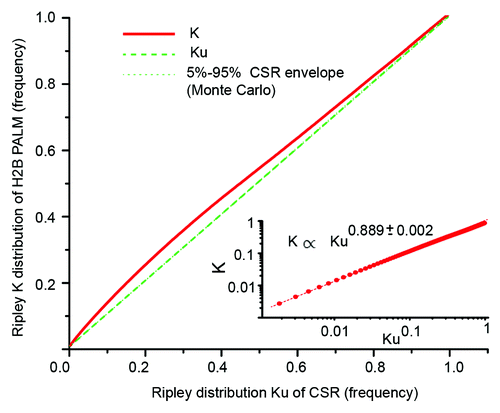
Figure 2. Re-sampling test of H2B distribution against complete spatial randomness (CSR). The Ripley K(r) distribution is the number of H2B detections that lie within a circular vicinity of a reference detection, averaged on all possible references. Ku(r) is the Ripley distribution obtained with the total number of detections redistributed in the nuclear volume under complete spatial randomness, averaged over 100 Monte Carlo repeats. For distances “r” between 0 and 3 µm with a 10 nm step, we computed K(r) and Ku(r), and plotted K(r) against Ku(r). We also plotted the 5% and 95% minimum and maximum quantiles of the Monte Carlo distribution, hardly visible due to the fast convergence of the statistic. As the K statistic never lies in the quantile envelope, the test that the actual distribution of H2B detections could be observed with CSR is rejected at almost every scale at the 10% confidence level. The two distributions K(r) and Ku(r) are expected to converge to each other at large scale. However, within the 3 µm range of our study the inset shows a log-log representation that displays a power law dependence between K(r) and Ku(r).

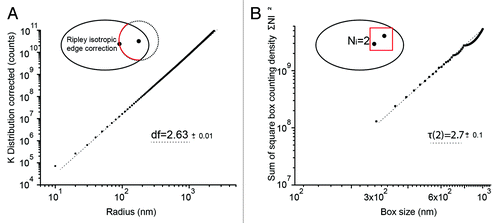
Figure 3. Correlation fractal dimension of H2B distribution. (A) Ripley inter-point K̂(r) distribution of H2B corrected for the geometry of the nuclear envelope and the uneven detection probability within the focal depth. K̂(r) displays a power law dependence that can be interpreted as the correlation fractal dimension df of H2B. (B) Average square number of detections per cubic boxes, as a function of the box radius. From reference Citation26, the power law τ(2) is a box counting estimate of the correlation fractal dimension df. The box counting method is less precise, but τ(2) is close to the value df that was measured with the Ripley K̂(r) distribution.

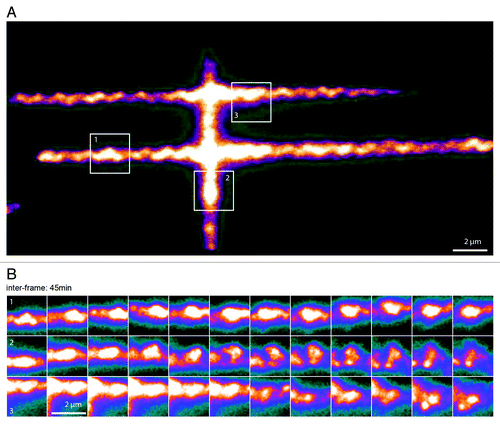
Figure 4. Spatiotemporal evolution of H2B distribution. (A) Pattern of photoactivation of H2B labeled with photo-activatable GFP (PA-GFP) in the nucleus of a U2Os cell. (B) Time-lapse images of three sub-regions followed over the course of 9 h, showing local condensation and de-condensation of chromatin (image acquisition time, 200 ms; inter frame time, 45 min). See Video 1 for a complete sequence of this figure.

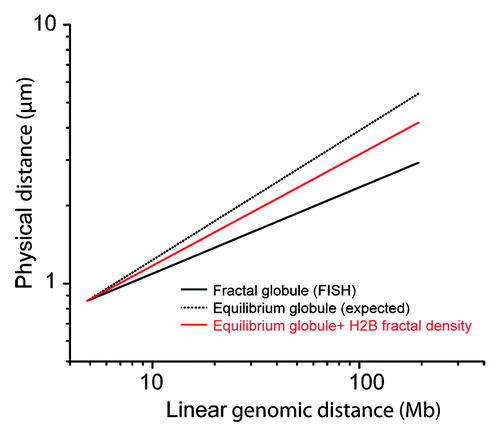
Figure 5. Superposition of H2B fractal density on the FISH model of fractal globule. The fractal globule is a model of conformation of a nuclear DNA with a low level of interminglement. The model can be fit on FISH data of references Citation5 and Citation6, with a relation between the physical distance R in the nucleus and the linear genetic distance s along the human chromosome V. This relation scales as a power law R(s) ∝ s1/3 for long-range interactions (thick black line). By applying a 3/2 exponent, we virtually obtain R(s) ∝ s1/2, which is characteristic of the equilibrium globule, a model of fully relaxed intermingled nuclear DNA (dotted back line). Finally, by applying a 2.7/3 exponent, we obtain the mean relation of distances between loci in the case a relaxed DNA chain, with a chromatin correlation dimension of 2.7 (red line). This graphic shows that the fractal correlation dimension has a strong impact on the interpretation of FISH measurements used as an additional proof of the validity of the fractal globule model.

