Figures & data
Figure 1. Novel Asf1 interactors revealed by TAP-Mass spectrometric analysis. (A) Proteins co-purifying with Asf1-TAP in yeast cells extract obtained with Buffer A, resolved by 12% Tricine-SDS. Indicated protein bands and gel fragments were excised and analyzed. Each band labeled as Asf1-CBP(*) or Asf1-CBP were cut and independently analyzed. (B) List of proteins identified in gel slices 1 and 2. Novel interactors of Asf1 are indicated in bold. The total number of peptides found for each protein is listed. (C) List of PTMs identified from Asf1-CBP(*) band. The specific modification and residues are indicated.
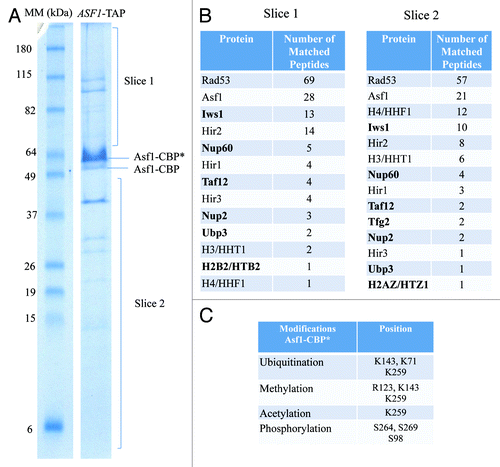
Table 1. Proteins co-purifying with Asf1-TAP identified by Mass spectrometric QSTAR XL analysis
Table 2. Proteins co-purifying with Asf1-TAP identified by Triple-TOF Mass spectrometric analysis
Figure 2. A network of Asf1 interactions identified by TAP-MS analyses. The interaction network was generated from the evidence view of the String interactions with a medium confidence score (0.04). Different line colors represent the types of evidence for the association. Components of the SAGA, TREX-2, HIR, and NPC are indicated.
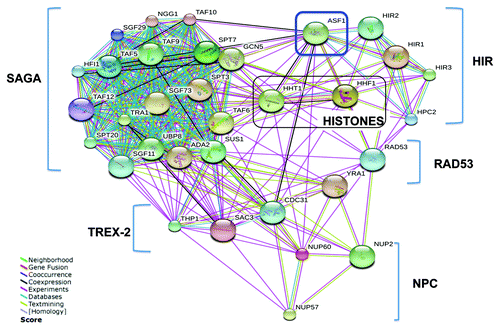
Figure 3. Asf1 interacts physically and genetically with TREX2. (A) Sus1 co-purifies with Asf1-TAP. Calmoduline eluates from TAP purifications of ASF1-TAPsus1Δ, ASF1-TAP, TAF9-TAP, and a non-tagged strain cells were assayed by western blot using the anti-Sus1 antibody (*). Size of proteins of the molecular marker (MM) is indicated and unspecific reacting bands are labeled with diamonds. (B) Asf1 co-purifies with Sus1-TAP. Calmoduline eluates from TAP purifications of SUS1-TAPasf1Δ and SUS1-TAP were assayed by western blot using anti-Asf1 (upper part) or anti-TAP showing Sus1 (lower). Unspecific reacting bands are labeled with diamonds. (C) List of proteins indicating the number of peptides identified from Thp1-TAP eluate by multidimensional protein identification technology. TREX-2 factors are indicated in red. (D) Cultures of wild-type, sus1Δ, asf1Δ, and sus1Δasf1Δ cells were diluted in 10−1 steps, and equivalent amount of cells were spotted onto YP + Glucose and incubated at 30 °C for 24 h. (E) Representative images of poly(A)+ RNA localization in wild-type, sus1Δ, and asf1Δ cells assayed by in situ hybridization using Cy3-labeled oligo(dT) probes. Cells were grown at 39 °C in YP + Glucose for 3 h.
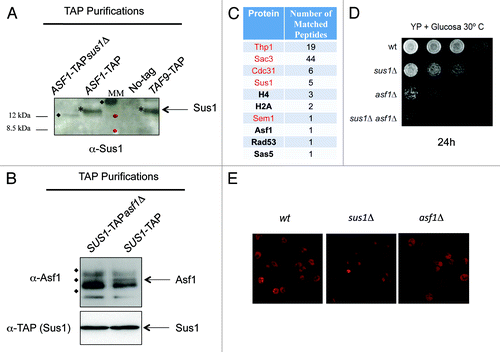
Figure 4. Asf1 is dispensable for Sus1 recruitment to GAL1. (A) Sus1 occupancy at the GAL1 promoter and ORF was monitored in the wild-type and asf1Δ cells after 25 min of galactose induction. The occupancy level was calculated as the signal ratio of the IP samples in relation to the input signal, minus the background of a no-antibody control. The resulting normalized ratios are plotted. Error bars represent SD for at least three independent experiments. Statistical analysis was performed using the Student’s t test and presented as a P value. P values less than 0.05 are statistically significant (B) GAL1 induction in wild-type and asf1Δ cells was analyzed after a 25 min shift from 2% raffinose to 2% galactose growing media. The relative GAL1 mRNA levels were determined by qPCR and normalized to the SCR1 mRNA levels. Values were referred to each strain at the zero time point. Error bars represent SD for at least three independent experiments. (C) The same results represented in (A) were plotted to compare Sus1 recruitment in GAL1 promoter and ORF for each strain. Statistical analysis was performed using the Student’s t test and presented as a P value. P values less than 0.05 are statistically significant.
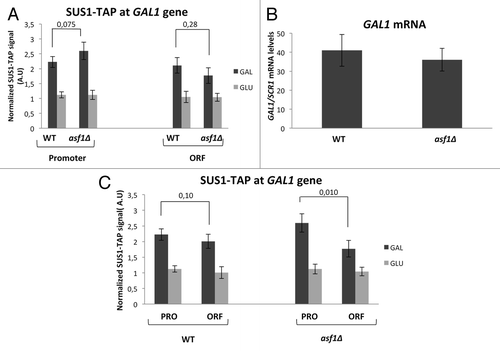
Figure 5. Deletion of SUS1 and THP1 affect H3 and H4 chromatin incorporation and H3K56 acetylation. (A) Absence of SUS1 increases H3 and H4 incorporation into chromatin. Two dilutions of chromatin extracts from each strain wild-type (wt), sus1Δ, asf1Δ, and sus1Δasf1Δ were obtained and subjected to SDS-PAGE and probed with anti-H3 and H4. A representative western blot is shown. Bar graph shows total histones normalized levels of chromatin incorporated H3 and H4 for each strain after quantification of western blot signals. Data are representative of three independent experiments. (B) As in (A) using anti-H3K56ac antibody. (C) Bar graph shows total histones normalized levels of chromatin incorporated H3, H4 and H3K56 for wild-type (wt) and thp1Δ after quantification of western blot signals. Data are representative of three independent experiments.
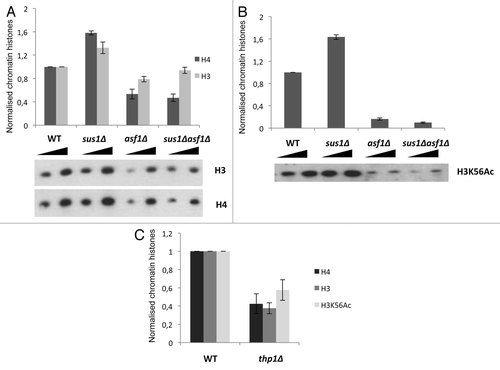
Figure 6. Asf1 is required for ubiquitination of histone H2B. (A) Western blot representing chromatin extracts from WT, asf1Δ, sus1Δasf1Δ, and sus1Δ strains. Proteins were resolved by 15% SDS-polyacrylamide gel, transferred to a nitrocellulose membrane and detected by ECL after incubation with H2Bub antibody. As illustrated, levels of H2Bub are decreased in asf1Δ compared with WT levels. On the contrary, H2Bub levels are increased in both sus1Δasf1Δ and sus1Δ strains. Ponceau S staining of the membrane before blotting served as the loading control. (B) Representative blot corresponding to WT, asf1Δ, sus1Δasf1Δ, and sus1Δ whole cell extracts. Proteins were resolved in the same manner as in (A). As indicated, the decreased levels of H2B-ub in asf1Δ compared with WT are restored in a sus1Δasf1Δ strain. PGK abundance was used as a loading control of all samples. Bar graph shows total H2Bub levels normalized to PGK after quantification of Western blot signals. Error bars represent SD for at least three independent experiments.
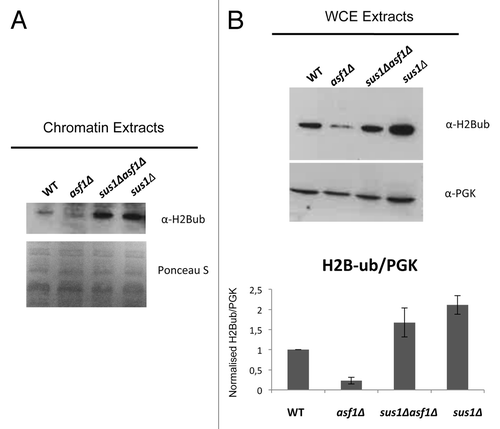
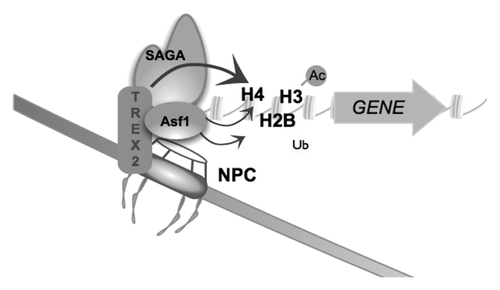
Figure 7. Asf1 interacts physically with TREX-2, SAGA, and NPC factors SAGA and TREX-2 regulate the tethering of some genes to the NPC. H3K56 acetylation (Ac) and H2B monoubiquitination (Ub) are affected by deletions of Asf1 and TREX-2. Incorporation into chromatin of histones H3 and H4 depends on the TREX-2 factors Sus1 and Thp1. These results open the possibility of a functional crosstalk between SAGA and H3K56ac mediated by Asf1 in the context of DNA replication or transcription at NPC-gated genes in which the chromatin context might be relevant.