1,327
Views
38
CrossRef citations to date
0
Altmetric
Original Research

Hepatic metastases of colorectal cancer are rather homogeneous but differ from primary lesions in terms of immune cell infiltration

, , , , , , , , , , , , & show all
Article: e24116 | Received 13 Jul 2012, Accepted 26 Feb 2013, Published online: 01 Apr 2013

Figures & data

Figure 1. Analytical steps. (A) Workflow for immune cell quantification, cytokine analysis and subsequent generation of a prognostic profile. (B) Analysis of opposite sides of a metastatic lesion. (C) Analysis of serial sections of a metastatic lesion.

Figure 1. Analytical steps. (A) Workflow for immune cell quantification, cytokine analysis and subsequent generation of a prognostic profile. (B) Analysis of opposite sides of a metastatic lesion. (C) Analysis of serial sections of a metastatic lesion.

Figure 2. Convergence of the average cell number with increasing surface tissue area. The circles on the vertical lines indicate the possible resulting average cell number. Increasing the number of analyzed 1 mm2 fields (as indicated on the x-axis) results in a stabilization of the average cell number for a given tissue section.

Figure 2. Convergence of the average cell number with increasing surface tissue area. The circles on the vertical lines indicate the possible resulting average cell number. Increasing the number of analyzed 1 mm2 fields (as indicated on the x-axis) results in a stabilization of the average cell number for a given tissue section.

Table 1. Cell densities in primary tumors and metastases

Figure 3. Immune cell infiltration of primary colorectal carcinoma lesions and hepatic colorectal carcinoma metastases. (A–D) Triangles represent the amount of CD3+,CD8+ and granzyme B+ cells detected in primary tumors and the corresponding metastasis. All axes show cell density (cells/mm2) and have the same scale.
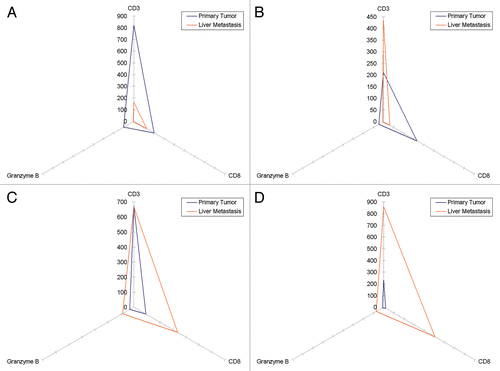
Figure 3. Immune cell infiltration of primary colorectal carcinoma lesions and hepatic colorectal carcinoma metastases. (A–D) Triangles represent the amount of CD3+,CD8+ and granzyme B+ cells detected in primary tumors and the corresponding metastasis. All axes show cell density (cells/mm2) and have the same scale.

Figure 4. Prognostic signature of immune cell infiltration in primary colorectal carcinoma lesions and hepatic colorectal carcinoma metastases. CD3+,CD8+ and granzyme B+ cell densities were translated into a favorable (good) or unfavorable (bad) prognostic signature as described by Galon et al. and Halama et al. Each of presented doublets (P, primary tumor; M, metastasis) represents the samples of a single patient. Green, favorable signature; Red, unfavorable signature.

Figure 4. Prognostic signature of immune cell infiltration in primary colorectal carcinoma lesions and hepatic colorectal carcinoma metastases. CD3+,CD8+ and granzyme B+ cell densities were translated into a favorable (good) or unfavorable (bad) prognostic signature as described by Galon et al. and Halama et al. Each of presented doublets (P, primary tumor; M, metastasis) represents the samples of a single patient. Green, favorable signature; Red, unfavorable signature.

Table 2. TNM classification and prognostic profile (based on immune cell densities)*

Figure 5. Correlation between cytokine profiles detected on opposite sides of hepatic metastases. (A–D) Scatterplots of four different hepatic metastases from four different patients Units displayed on both axes are pg/mL (logarithmic scale) and each axis represents a different side of the lesion, with each spot representing a single analyte. Spearman’s correlation coefficients (Rs) were calculated for each of the four data sets, yielding the following statistics. (A) Rs = 0.882, p = 0.0001; (B) Rs = 0.922, p = 0.0001; (C) Rs = 0.9, p = 0.0001; (D) Rs = 0.975, p = 0.0001. Samples (A) and (C) were analyzed for 21 analytes, samples (B) and (D) for 23 (for the detailed list of analytes, please see the Results section).
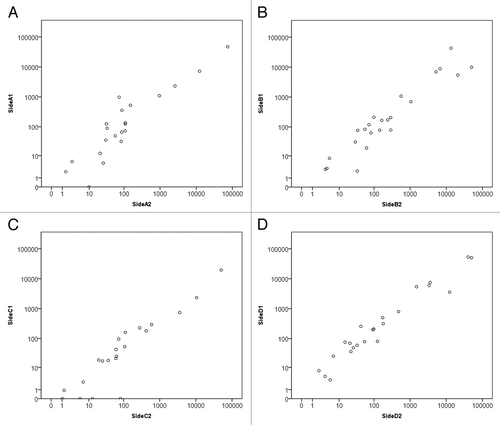
Figure 5. Correlation between cytokine profiles detected on opposite sides of hepatic metastases. (A–D) Scatterplots of four different hepatic metastases from four different patients Units displayed on both axes are pg/mL (logarithmic scale) and each axis represents a different side of the lesion, with each spot representing a single analyte. Spearman’s correlation coefficients (Rs) were calculated for each of the four data sets, yielding the following statistics. (A) Rs = 0.882, p = 0.0001; (B) Rs = 0.922, p = 0.0001; (C) Rs = 0.9, p = 0.0001; (D) Rs = 0.975, p = 0.0001. Samples (A) and (C) were analyzed for 21 analytes, samples (B) and (D) for 23 (for the detailed list of analytes, please see the Results section).

Figure 6. (A) Heterogeneity of synchronous hepatic metastases of colorectal carcinoma. Overview image of two synchronous hepatic metastases of colorectal carcinoma stained for CD3+ cells, showing a liver section with two round metastases (marked with an asterisk and a triangle, magnification 1.5×). (B) Magnification (10×) of the right metastatic lesion in (A) (triangle). CD3+ cell infiltrates are clearly discernible at the invasive margin and in the adjacent liver. (C) Magnification (10×) of the left metastatic lesion in (A) (asterisk). CD3+ cell infiltrates at the invasive margin are scarce, tumor cells accumulate at the same location, and the core of lesion exhibits large arterial vessels but mainly consists of stromal components.
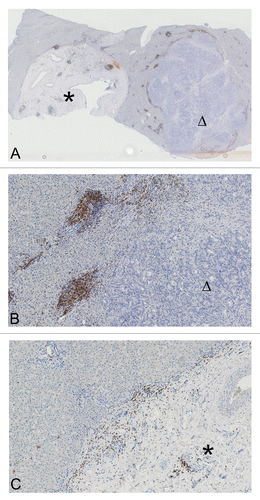
Figure 6. (A) Heterogeneity of synchronous hepatic metastases of colorectal carcinoma. Overview image of two synchronous hepatic metastases of colorectal carcinoma stained for CD3+ cells, showing a liver section with two round metastases (marked with an asterisk and a triangle, magnification 1.5×). (B) Magnification (10×) of the right metastatic lesion in (A) (triangle). CD3+ cell infiltrates are clearly discernible at the invasive margin and in the adjacent liver. (C) Magnification (10×) of the left metastatic lesion in (A) (asterisk). CD3+ cell infiltrates at the invasive margin are scarce, tumor cells accumulate at the same location, and the core of lesion exhibits large arterial vessels but mainly consists of stromal components.

Figure 7. Homogeneity of synchronous hepatic metastases of colorectal carcinoma. (A and B) Overview image (2.5× magnification) of synchronous hepatic metastases of colorectal carcinoma stained for CD3+ cells. In this case, CD3+ cell infiltration in both metastases is comparable.

Figure 7. Homogeneity of synchronous hepatic metastases of colorectal carcinoma. (A and B) Overview image (2.5× magnification) of synchronous hepatic metastases of colorectal carcinoma stained for CD3+ cells. In this case, CD3+ cell infiltration in both metastases is comparable.

Figure 8. Homogeneity of synchronous hepatic metastases of colorectal carcinoma. (A and B) Overview image (2.5× magnification) of synchronous hepatic metastases of colorectal carcinoma stained for CD3+ cells. In this case, CD3+ cell infiltration in both metastases is comparable.

Figure 8. Homogeneity of synchronous hepatic metastases of colorectal carcinoma. (A and B) Overview image (2.5× magnification) of synchronous hepatic metastases of colorectal carcinoma stained for CD3+ cells. In this case, CD3+ cell infiltration in both metastases is comparable.

Table 3. TNM classification and cytokine profile*

Supplemental material

Additional material

Download Zip (71.9 KB)