760
Views
13
CrossRef citations to date
0
Altmetric
Author's View

Attenuated measles virus used as an oncolytic virus activates myeloid and plasmacytoid dendritic cells

, , &
Article: e24212 | Received 01 Mar 2013, Accepted 06 Mar 2013, Published online: 01 May 2013

Figures & data

Figure 1. Attenuated measles virus (MV) antitumoral virotherapy activates myeloid and plasmacytoid dendritic cells, notably their capacity to cross-present tumor-associated antigens (TAA): MV preferentially infects tumor cells due to their overexpression of CD46. MV-infected tumor cells are lysed. They induce maturation of myeloid DC, mainly by DAMP expression (HSP70, gp96, IFNα, IFNβ, HMGB1, IL-6, IL-8), and maturation of plasmacytoid DC, mainly by MV single-strand RNA, a pathogen associated molecular pattern (PAMP) that triggers TLR7 expressed by pDC. DC internalized fragments of MV-infected tumor cells and cross-present TAA to specific CD8+ T cells. It has been demonstrated for myeloid DC that this cross-presentation can result in cross-priming, whereas this has not been demonstrated for pDC. pDC also produce large amount of IFN-α in response to tumor infected cells. This figure has been made using Servier Medical Art.
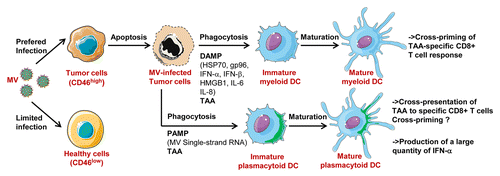
Figure 1. Attenuated measles virus (MV) antitumoral virotherapy activates myeloid and plasmacytoid dendritic cells, notably their capacity to cross-present tumor-associated antigens (TAA): MV preferentially infects tumor cells due to their overexpression of CD46. MV-infected tumor cells are lysed. They induce maturation of myeloid DC, mainly by DAMP expression (HSP70, gp96, IFNα, IFNβ, HMGB1, IL-6, IL-8), and maturation of plasmacytoid DC, mainly by MV single-strand RNA, a pathogen associated molecular pattern (PAMP) that triggers TLR7 expressed by pDC. DC internalized fragments of MV-infected tumor cells and cross-present TAA to specific CD8+ T cells. It has been demonstrated for myeloid DC that this cross-presentation can result in cross-priming, whereas this has not been demonstrated for pDC. pDC also produce large amount of IFN-α in response to tumor infected cells. This figure has been made using Servier Medical Art.