1,082
Views
35
CrossRef citations to date
0
Altmetric
Original Research

Prostate cancer stem cells are targets of both innate and adaptive immunity and elicit tumor-specific immune responses

, , , , , , , , , & show all
Article: e24520 | Received 07 Dec 2012, Accepted 02 Apr 2013, Published online: 16 Apr 2013

Figures & data

Figure 1. Phenotypic characterization of cancer stem cells. Prostate adenocarcinoma-derived stem cells (PAC-SCs, left column), prostatic neuroendocrine tumor-derived stem cells (PNE-SCs, middle column) and TRAMP-C1 cells (right column) were harvested, dissociated to single-cell suspension, stained with FITC-, PE- or APC-conjugated antibodies specific for the indicated markers and analyzed by cytofluorimetry. Histograms illustrate the expression of specific markers (black profiles). White profiles represent isotype controls. Each panel is representative of three independent experiments.
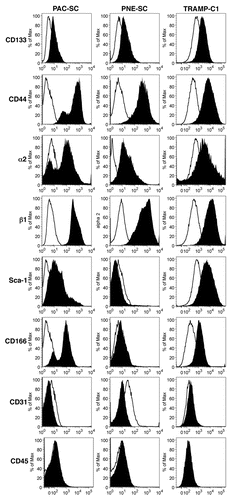
Figure 1. Phenotypic characterization of cancer stem cells. Prostate adenocarcinoma-derived stem cells (PAC-SCs, left column), prostatic neuroendocrine tumor-derived stem cells (PNE-SCs, middle column) and TRAMP-C1 cells (right column) were harvested, dissociated to single-cell suspension, stained with FITC-, PE- or APC-conjugated antibodies specific for the indicated markers and analyzed by cytofluorimetry. Histograms illustrate the expression of specific markers (black profiles). White profiles represent isotype controls. Each panel is representative of three independent experiments.
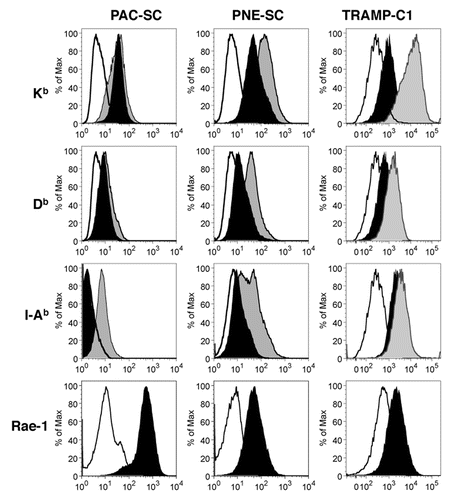
Figure 2. Prostate adenocarcinoma-derived and prostatic neuroendocrine tumor-derived stem cell express MHC molecules and other relevant immunologic markers. Prostate adenocarcinoma-derived stem cells (PAC-SCs, left column), prostatic neuroendocrine tumor-derived stem cells (PNE-SCs, middle column) and TRAMP-C1 cells (right column) were cultured in standard medium (black profiles) or in the presence of interferon γ (IFNγ, gray profiles) for 48 h, then harvested and analyzed as described in the legend to . Histograms illustrate the expression of specific markers (black or gray profiles). White profiles represent isotype controls. Each panel is representative of three independent experiments.

Figure 2. Prostate adenocarcinoma-derived and prostatic neuroendocrine tumor-derived stem cell express MHC molecules and other relevant immunologic markers. Prostate adenocarcinoma-derived stem cells (PAC-SCs, left column), prostatic neuroendocrine tumor-derived stem cells (PNE-SCs, middle column) and TRAMP-C1 cells (right column) were cultured in standard medium (black profiles) or in the presence of interferon γ (IFNγ, gray profiles) for 48 h, then harvested and analyzed as described in the legend to Figure 1. Histograms illustrate the expression of specific markers (black or gray profiles). White profiles represent isotype controls. Each panel is representative of three independent experiments.

Figure 3. Prostate adenocarcinoma-derived and prostatic neuroendocrine tumor-derived stem cell express prostate-specific antigens and can be targeted in vitro by antigen-specific cytotoxic T lymphocytes and natural killer cells. (A) Expression of STEAP, PSCA or Tag was measured in prostate adenocarcinoma-derived stem cells (PAC-SCs), prostatic neuroendocrine tumor-derived stem cells (PNE-SCs) or TRAMP-C1 cells by real-time PCR and the ΔΔCT method. Expression data are normalized to TRAMP-C1 (for STEAP and PSCA) or B6/K0 (for Tag) cells. (B) Upper left panel. Tag-specific CD8+ T-cell blasts were tested for their cytotoxic activity against PAC-SCs, PNE-SCs, unpulsed (−) or Tag-IV404–411-pulsed RMA cells (+) in a standard 51Cr release assay (effector to target ratio of 50:1). Upper right panel, PSCA-specific CD8+ T-cell blasts were challenged with PAC-SCs, PNE-SCs, unpulsed (−) or PSCA83–91-pulsed RMA cells (+) and analyzed for intracellular interferon γ (IFNγ) production by cytofluorimetry. Data are reported as the percentage of CD44+IFNγ+ cells among CD8+ T cells in each experimental condition tested. Values reported in each column are subtracted of background noise (i.e., IFNγ production against the irrelevant target RMA). Lower panels, representative dot plots. Dot plots are gated on CD8+ T cells. The percentage of CD44+IFNγ+ cells is indicated in each plot. (B) Natural killer (NK) (left panel) and lymphokine-activated killer (LAK) (right panel) cells were tested for their cytotoxic activity against PAC-SCs, PNE-SCs, RMA-S (+) or RMA cells (−) in a standard 51Cr release assay (effector to target ratios of 40:1 or 50:1, in the left and right panel, respectively). (D) 2 × 10⁶ PAC-SCs (left panel) or PNE-SCs (right panel) were injected in 200 μL DMEM into NOD-SCID, nude, wild type (WT) or TRAMP mice (at least 10 mice/group). Mice were monitored for tumor formation and survival, and sacrificed when lesions reached 100 mm2 of area or after 6 mo of observation. Data were compared with ANOVA followed by Tukey’s tests: *p < 0.05; **p < 0.01; ***p < 0.001. Each panel is representative of at least two independent experiments.
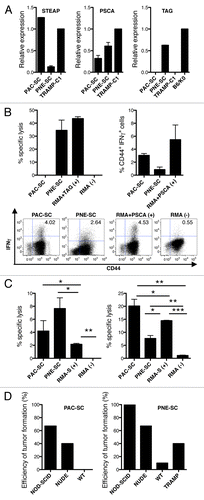
Figure 3. Prostate adenocarcinoma-derived and prostatic neuroendocrine tumor-derived stem cell express prostate-specific antigens and can be targeted in vitro by antigen-specific cytotoxic T lymphocytes and natural killer cells. (A) Expression of STEAP, PSCA or Tag was measured in prostate adenocarcinoma-derived stem cells (PAC-SCs), prostatic neuroendocrine tumor-derived stem cells (PNE-SCs) or TRAMP-C1 cells by real-time PCR and the ΔΔCT method. Expression data are normalized to TRAMP-C1 (for STEAP and PSCA) or B6/K0 (for Tag) cells. (B) Upper left panel. Tag-specific CD8+ T-cell blasts were tested for their cytotoxic activity against PAC-SCs, PNE-SCs, unpulsed (−) or Tag-IV404–411-pulsed RMA cells (+) in a standard 51Cr release assay (effector to target ratio of 50:1). Upper right panel, PSCA-specific CD8+ T-cell blasts were challenged with PAC-SCs, PNE-SCs, unpulsed (−) or PSCA83–91-pulsed RMA cells (+) and analyzed for intracellular interferon γ (IFNγ) production by cytofluorimetry. Data are reported as the percentage of CD44+IFNγ+ cells among CD8+ T cells in each experimental condition tested. Values reported in each column are subtracted of background noise (i.e., IFNγ production against the irrelevant target RMA). Lower panels, representative dot plots. Dot plots are gated on CD8+ T cells. The percentage of CD44+IFNγ+ cells is indicated in each plot. (B) Natural killer (NK) (left panel) and lymphokine-activated killer (LAK) (right panel) cells were tested for their cytotoxic activity against PAC-SCs, PNE-SCs, RMA-S (+) or RMA cells (−) in a standard 51Cr release assay (effector to target ratios of 40:1 or 50:1, in the left and right panel, respectively). (D) 2 × 10⁶ PAC-SCs (left panel) or PNE-SCs (right panel) were injected in 200 μL DMEM into NOD-SCID, nude, wild type (WT) or TRAMP mice (at least 10 mice/group). Mice were monitored for tumor formation and survival, and sacrificed when lesions reached 100 mm2 of area or after 6 mo of observation. Data were compared with ANOVA followed by Tukey’s tests: *p < 0.05; **p < 0.01; ***p < 0.001. Each panel is representative of at least two independent experiments.

Figure 4. Vaccination with dendritic cells pulsed with prostate adenocarcinoma-derived or prostatic neuroendocrine tumor-derived stem cells elicit an antigen-specific cytotoxic T-lymphocyte response. (A–C) C57BL/6 mice were injected intradermally with 5 × 10⁵ dendritic cells (DCs) pulsed with prostate adenocarcinoma-derived stem cells (DC+PAC-SC), prostatic neuroendocrine tumor-derived stem cells (DC+PNE-SC), TRAMP-C1 cells (DC+TRAMP-C1), unpulsed DCs (DC w/o) or 200 μL of PBS (naive) and killed one week later. (A) Splenocytes were stimulated in vitro and 5-d-old blasts were assessed for cytotoxic activity against PAC-SCs (black squares), PNE-SCs (black triangles), TRAMP-C1 cells (white circles) or RMA cells (black circles) in standard 51Cr release assays. (B) Alternatively, blasts were challenged as indicated and analyzed for intracellular interferon γ (IFNγ) production by cytofluorometry. Dot plots are gated on CD8+ T cells. The percentage of CD44+IFNγ+ cells is indicated in each plot. (C) Histograms depict the quantification of IFNγ production by CD8+ T cells against PAC-SCs (left panel) PNE-SCs (middle panel) or TRAMP-C1 cells (right panel). Values are subtracted of background noise (i.e., IFNγ production against the irrelevant target RMA). Each panel is representative of at least three independent experiments. Data were compared with Student's t tests: *p < 0.05.
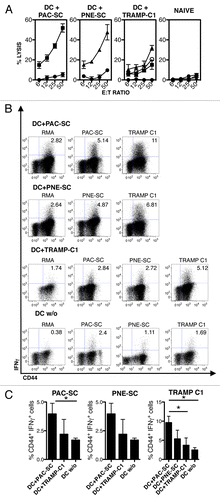
Figure 4. Vaccination with dendritic cells pulsed with prostate adenocarcinoma-derived or prostatic neuroendocrine tumor-derived stem cells elicit an antigen-specific cytotoxic T-lymphocyte response. (A–C) C57BL/6 mice were injected intradermally with 5 × 10⁵ dendritic cells (DCs) pulsed with prostate adenocarcinoma-derived stem cells (DC+PAC-SC), prostatic neuroendocrine tumor-derived stem cells (DC+PNE-SC), TRAMP-C1 cells (DC+TRAMP-C1), unpulsed DCs (DC w/o) or 200 μL of PBS (naive) and killed one week later. (A) Splenocytes were stimulated in vitro and 5-d-old blasts were assessed for cytotoxic activity against PAC-SCs (black squares), PNE-SCs (black triangles), TRAMP-C1 cells (white circles) or RMA cells (black circles) in standard 51Cr release assays. (B) Alternatively, blasts were challenged as indicated and analyzed for intracellular interferon γ (IFNγ) production by cytofluorometry. Dot plots are gated on CD8+ T cells. The percentage of CD44+IFNγ+ cells is indicated in each plot. (C) Histograms depict the quantification of IFNγ production by CD8+ T cells against PAC-SCs (left panel) PNE-SCs (middle panel) or TRAMP-C1 cells (right panel). Values are subtracted of background noise (i.e., IFNγ production against the irrelevant target RMA). Each panel is representative of at least three independent experiments. Data were compared with Student's t tests: *p < 0.05.

Figure 5. Dendritic cells pulsed with prostate adenocarcinoma-derived stem cells delay the growth of transplantable prostate tumors. (A) C57BL/6 male mice were immunized with 5 × 10⁵ dendritic cells (DCs) pulsed with either prostate adenocarcinoma-derived stem cells (DC+PAC-SC; n = 16, black squares), either prostatic neuroendocrine tumor-derived stem cells (DC+PNE-SC; n = 10, black circles), either TRAMP-C1 cells (DC+TRAMP-C1; n = 10 white triangles) or nothing (DC w/o; n = 14, white squares) and challenged one week later with 2.5 × 10⁶ TRAMP-C1 cells s.c.. Mice were monitored twice a week and sacrificed when the tumor size reached a surface area ≥ 100 mm2. Data are reported in a Kaplan–Maier plot. Statistical comparisons were performed by means of the logrank tests: DC+PAC-SC vs DC+TRAMP-C1, p = 0.044 (*); DC+PAC-SC vs DC w/o, p = 0.029 (*); DC+PAC-SC vs DC+PNE-SC, p = 0.024 (*) All the other comparisons were not statistically significant. (B) C57BL/6 mice were immunized either with DC+PAC-SC (n = 5; black squares) or DC w/o (n = 5; white squares), challenged one week later with 7 × 10⁴ RMA cells and monitored as described in (A). (C) C57BL/6 males were challenged with 2 × 10⁶ PAC-SCs admixed with Matrigel s.c. and immunized two weeks later with DC+PAC-SC (n = 10, black squares) or DC w/o (n = 10, white squares). Mice were monitored three times a week for tumor formation and progression, and were killed 78 d after tumor challenge. Data are reported as average ± SD of tumor volume (mm3). Statistical comparisons were performed by means of Student's t-tests: **p < 0.01.
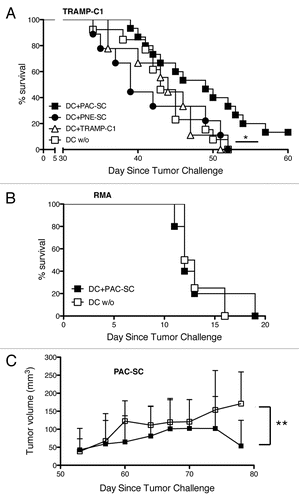
Figure 5. Dendritic cells pulsed with prostate adenocarcinoma-derived stem cells delay the growth of transplantable prostate tumors. (A) C57BL/6 male mice were immunized with 5 × 10⁵ dendritic cells (DCs) pulsed with either prostate adenocarcinoma-derived stem cells (DC+PAC-SC; n = 16, black squares), either prostatic neuroendocrine tumor-derived stem cells (DC+PNE-SC; n = 10, black circles), either TRAMP-C1 cells (DC+TRAMP-C1; n = 10 white triangles) or nothing (DC w/o; n = 14, white squares) and challenged one week later with 2.5 × 10⁶ TRAMP-C1 cells s.c.. Mice were monitored twice a week and sacrificed when the tumor size reached a surface area ≥ 100 mm2. Data are reported in a Kaplan–Maier plot. Statistical comparisons were performed by means of the logrank tests: DC+PAC-SC vs DC+TRAMP-C1, p = 0.044 (*); DC+PAC-SC vs DC w/o, p = 0.029 (*); DC+PAC-SC vs DC+PNE-SC, p = 0.024 (*) All the other comparisons were not statistically significant. (B) C57BL/6 mice were immunized either with DC+PAC-SC (n = 5; black squares) or DC w/o (n = 5; white squares), challenged one week later with 7 × 10⁴ RMA cells and monitored as described in (A). (C) C57BL/6 males were challenged with 2 × 10⁶ PAC-SCs admixed with Matrigel™ s.c. and immunized two weeks later with DC+PAC-SC (n = 10, black squares) or DC w/o (n = 10, white squares). Mice were monitored three times a week for tumor formation and progression, and were killed 78 d after tumor challenge. Data are reported as average ± SD of tumor volume (mm3). Statistical comparisons were performed by means of Student's t-tests: **p < 0.01.

Figure 6. Dendritic cells pulsed with prostate adenocarcinoma-derived stem cells cooperate with hematopoietic stem cell transplantation and donor lymphocyte infusion in inducing tumor regression in TRAMP mice. (A and B) Sixteen week-old TRAMP mice received total body irradiation (TBI), 1 × 10⁷ bone marrow cells from C57BL/6 female donors (hematopoietic stem cell transplantation, HSCT), 6 × 10⁷ splenocytes from non-presensitized C57BL/6 female donors (donor lymphocyte infusion, DLI), two vaccinations with dendritic cells (DCs) pulsed with either prostate adenocarcinoma-derived stem cells (DC+PAC-SC; n = 6), either STEAP (CD+STEAPn = 9) or nothing (DC w/o; n = 6), and were killed one week after the last vaccination. The urogenital apparata (UGA) of euthanized mice were collected and embedded in paraffin. Slides were stained with hematoxylin and eosin (H&E) (B) and scored by a trained pathologist in a blind fashion (A). Statistical comparisons were performed by means of χ2 tests: *p < 0.05
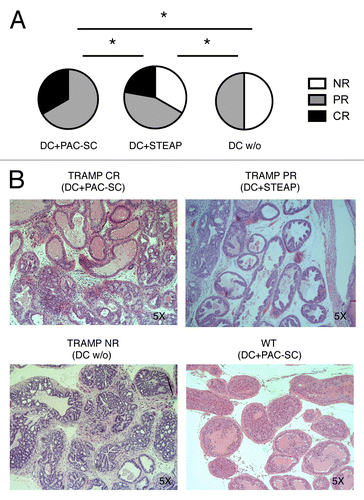
Figure 6. Dendritic cells pulsed with prostate adenocarcinoma-derived stem cells cooperate with hematopoietic stem cell transplantation and donor lymphocyte infusion in inducing tumor regression in TRAMP mice. (A and B) Sixteen week-old TRAMP mice received total body irradiation (TBI), 1 × 10⁷ bone marrow cells from C57BL/6 female donors (hematopoietic stem cell transplantation, HSCT), 6 × 10⁷ splenocytes from non-presensitized C57BL/6 female donors (donor lymphocyte infusion, DLI), two vaccinations with dendritic cells (DCs) pulsed with either prostate adenocarcinoma-derived stem cells (DC+PAC-SC; n = 6), either STEAP (CD+STEAPn = 9) or nothing (DC w/o; n = 6), and were killed one week after the last vaccination. The urogenital apparata (UGA) of euthanized mice were collected and embedded in paraffin. Slides were stained with hematoxylin and eosin (H&E) (B) and scored by a trained pathologist in a blind fashion (A). Statistical comparisons were performed by means of χ2 tests: *p < 0.05
Supplemental material

Additional material

Download Zip (1.2 MB)