506
Views
21
CrossRef citations to date
0
Altmetric
Research Paper

An Elasto-Plastic Model of Avian Gastrulation

Pages 6-16 | Published online: 26 Jan 2005

Figures & data

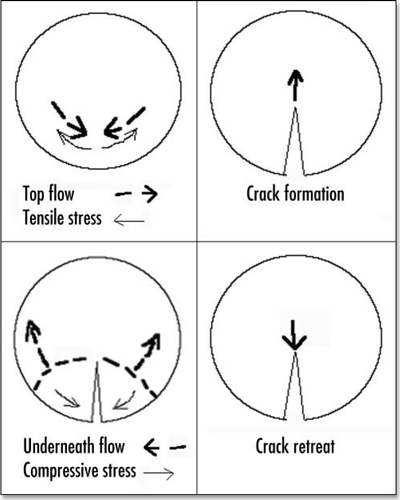
Figure 1 Schematic view of the blastodisc on top of the yolk.

Figure 1 Schematic view of the blastodisc on top of the yolk.

Figure 2 Schematic view of the blastodisc prior to gastrulation, and just after formation of the primitive streak and Hensen's node.
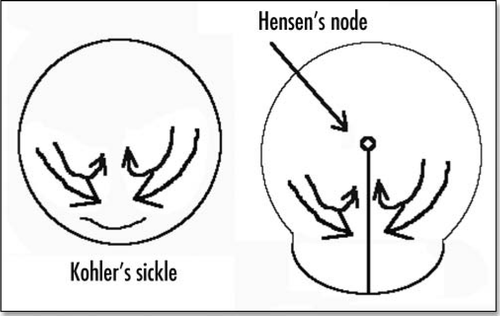
Figure 2 Schematic view of the blastodisc prior to gastrulation, and just after formation of the primitive streak and Hensen's node.

Figure 3 (A) When a true liquid is pushed between two glass plates, it flows with a parabolic profile of fluid speed. (B) However when a solid is pushed between plates, it will only deform, and adopt a parabolic deformation.
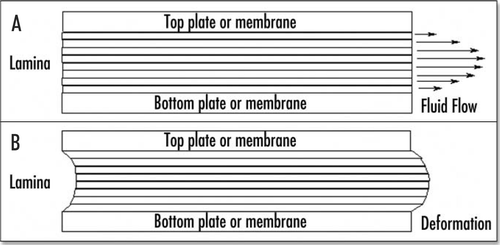
Figure 3 (A) When a true liquid is pushed between two glass plates, it flows with a parabolic profile of fluid speed. (B) However when a solid is pushed between plates, it will only deform, and adopt a parabolic deformation.

Figure 4 Schematic representation of a cell embedded between extracellular membranes, and crawling towards the posterior pole. A little elementary volume of tissue undergoes a tensile stress. The excess of filopodia to the right represents the filopodia gradient. The posterior pole undergoes tractions from both sides, hence it sees a tensile force twice as big as the tensile force generated by the filopodia.
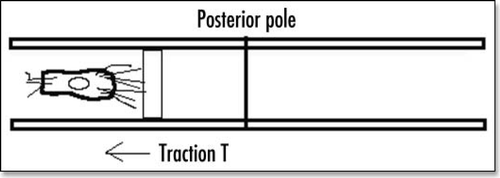
Figure 4 Schematic representation of a cell embedded between extracellular membranes, and crawling towards the posterior pole. A little elementary volume of tissue undergoes a tensile stress. The excess of filopodia to the right represents the filopodia gradient. The posterior pole undergoes tractions from both sides, hence it sees a tensile force twice as big as the tensile force generated by the filopodia.

Figure 5 The stream lines with one single source of force (located in the nip) oriented vertically.

Figure 5 The stream lines with one single source of force (located in the nip) oriented vertically.

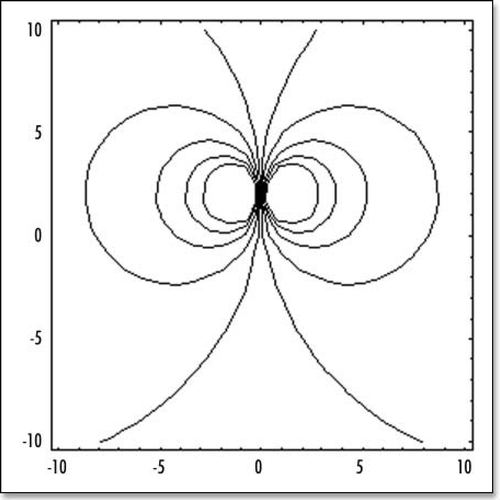
Figure 6 The stream lines with symmetrical forces, oriented face to face. These model the attractive (contractile) effect of Kohler's sickle. (A) depicts schematically the situation. (B) shows the stream lines for two centers of forces (one on each side, top and bottom, located at −R/10 and +R/10). (C) shows the streamlines for six aligned centers of forces modeling Kohler's sickle as a line of pulling agents (located at ±R/30, ±2R/30, ±R/10).

Figure 6 The stream lines with symmetrical forces, oriented face to face. These model the attractive (contractile) effect of Kohler's sickle. (A) depicts schematically the situation. (B) shows the stream lines for two centers of forces (one on each side, top and bottom, located at −R/10 and +R/10). (C) shows the streamlines for six aligned centers of forces modeling Kohler's sickle as a line of pulling agents (located at ±R/30, ±2R/30, ±R/10).

Figure 7 (A) Typical small deformation of the blastodisc, as a consequence of this “flow”. It is obtained by starting with a circle, and let it “flow” in the “flow” map. In this calculation, the forces were located at a distance 7/10 of R towards the caudal pole, and they were spanning a width equal to 2/10 of R on each side. The deformation creates a thin tail, and a bigger anterior part, as observed. The tail extends caudaly (so to speak) and the embryo body is strangled on its perimeter, with an orientation towards the nip of Kohler's sickle, as observed. (B) If two more time steps are performed one finds the following evolution. However, the force itself is no longer located simply along a straight segment, therefore the calculation cannot be pursued without calculating self-consistently the force distribution.
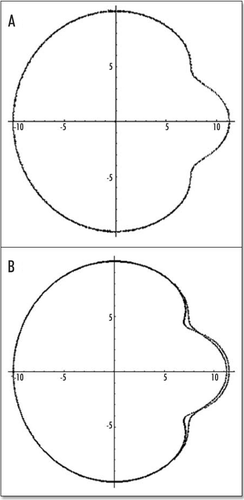
Figure 7 (A) Typical small deformation of the blastodisc, as a consequence of this “flow”. It is obtained by starting with a circle, and let it “flow” in the “flow” map. In this calculation, the forces were located at a distance 7/10 of R towards the caudal pole, and they were spanning a width equal to 2/10 of R on each side. The deformation creates a thin tail, and a bigger anterior part, as observed. The tail extends caudaly (so to speak) and the embryo body is strangled on its perimeter, with an orientation towards the nip of Kohler's sickle, as observed. (B) If two more time steps are performed one finds the following evolution. However, the force itself is no longer located simply along a straight segment, therefore the calculation cannot be pursued without calculating self-consistently the force distribution.

Figure 8 The actual shape of the tail depends on the location of the forces inside the caudal pole (the distance to the center of the blastodisc), and on the size of the segment which exerts the force. In (A), the force is located at 2/10 of R, in the caudal half, in this case, the tail part is almost as big as the head part. In (B), the force is located closer to the caudal pole, by 8/10 of R, the “flow” generates only a little tail.
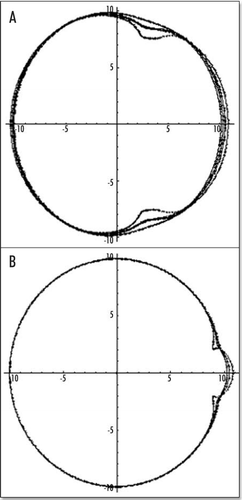
Figure 8 The actual shape of the tail depends on the location of the forces inside the caudal pole (the distance to the center of the blastodisc), and on the size of the segment which exerts the force. In (A), the force is located at 2/10 of R, in the caudal half, in this case, the tail part is almost as big as the head part. In (B), the force is located closer to the caudal pole, by 8/10 of R, the “flow” generates only a little tail.

Figure 9 (A–C) The distribution of stress inside the blastodisc, in the region of Kohler's sickle. (A) σxx; (B) σyy. (A) shows that the highest stress (dark) inside the blastodisc in the region of Kohler's sickle, is tensile orthoradially (the biggest component is the derivative of the orthoradial deformation). In simple terms, the extracellular matrix is torn apart by the two halves which pull the cells towards Kohler's sickle. Please pay attention to the fact that the other component of the stress is compressive in the region of Kohler's sickle. (C) depicts the tensile component along the orthoradial direction of the stress field in the blastoderm, in order to understand better (A). Along the AP axis, and on either sides of Kohler's sickle, the region of high stress is the caudal axis itself, and the stress is oriented orthoradially: this is exactly the best condition for a crack. In other areas, the stress does not have a tensile component oriented perpendicularly to the axis defined by the region of high magnitude. For example, if one looks at the darker areas defined by the high magnitude of σyy (B) one sees that these areas form large lobes similar to the ones for σxx, but these are not oriented perpendicularly to the y axis. Due to numerical artefacts, the very center of the calculation (the location of the forces) appears homogenously white (A) or black (B), but one should prolongate and complete the lobes by thought.
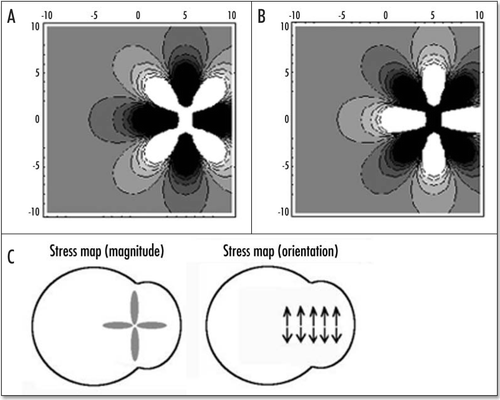
Figure 9 (A–C) The distribution of stress inside the blastodisc, in the region of Kohler's sickle. (A) σxx; (B) σyy. (A) shows that the highest stress (dark) inside the blastodisc in the region of Kohler's sickle, is tensile orthoradially (the biggest component is the derivative of the orthoradial deformation). In simple terms, the extracellular matrix is torn apart by the two halves which pull the cells towards Kohler's sickle. Please pay attention to the fact that the other component of the stress is compressive in the region of Kohler's sickle. (C) depicts the tensile component along the orthoradial direction of the stress field in the blastoderm, in order to understand better (A). Along the AP axis, and on either sides of Kohler's sickle, the region of high stress is the caudal axis itself, and the stress is oriented orthoradially: this is exactly the best condition for a crack. In other areas, the stress does not have a tensile component oriented perpendicularly to the axis defined by the region of high magnitude. For example, if one looks at the darker areas defined by the high magnitude of σyy (B) one sees that these areas form large lobes similar to the ones for σxx, but these are not oriented perpendicularly to the y axis. Due to numerical artefacts, the very center of the calculation (the location of the forces) appears homogenously white (A) or black (B), but one should prolongate and complete the lobes by thought.

Figure 10 Situation after opening of the “crack”.

Figure 10 Situation after opening of the “crack”.

Figure 11 Very simplified picture of a strip of cells which is put in tension, then cracked. As cells ingress and crawl backwards, the region of the crack feels less tension.
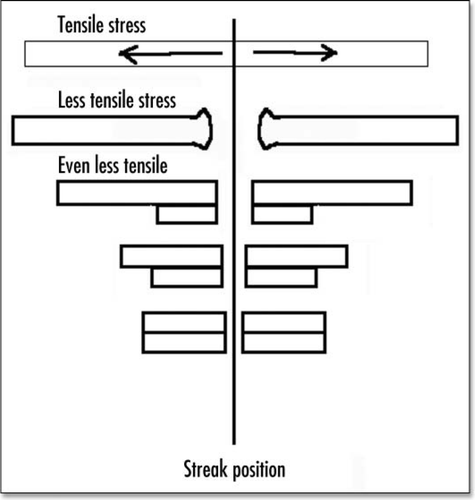
Figure 11 Very simplified picture of a strip of cells which is put in tension, then cracked. As cells ingress and crawl backwards, the region of the crack feels less tension.

Figure 12 Shematic view of crack opening and retreat.

Figure 12 Shematic view of crack opening and retreat.

Figure 13 A typical chicken embryo by day 4, showing the eight shaped area pellucida, and the location of the vitteline arteries, which always form in the region of the “funnel” of the eight.
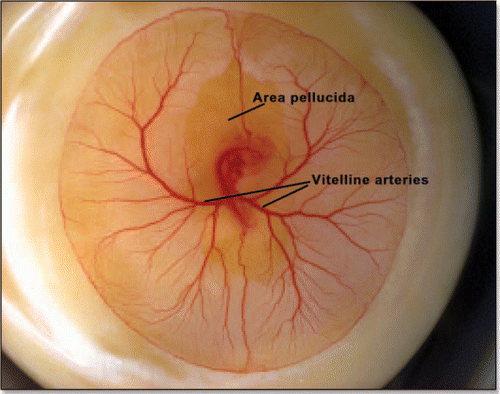
Figure 13 A typical chicken embryo by day 4, showing the eight shaped area pellucida, and the location of the vitteline arteries, which always form in the region of the “funnel” of the eight.

Figure 14 (A) A typical eight shaped area pellucida seen in the center of the yolk sac, surrounding the embryo, at day 1. The head is towards the top (12 o'clock), the tail towards the bottom. Blood islands are visible in the yolk sac The arteries will form the next day in the region of the nip of the eight. (Image courtesy of Lenoble F, U. Maastricht). (B) A typical theoretical blastodisc shape, if several deformation steps are performed (the AP axis is horizontal). A sector of the circle is actually sucked towards the nip where Kohler's sickle is exerting its force, while the tail extends caudaly. In this picture, the blastodisc adopts progressively an eight shape with a singular region in the region of the nip of the eight. In the center of this nip, one finds the center of the vortices seen in and C. This may be the origin of the prepattern of vitteline arteries. However, the calculated pattern is not as elongated as observed. In the actual embryo, there is obviously an additional extension in the AP direction, which is absent from this model. If we assume that this additional deformation does not change the global topology of the problem (mere change in aspect ratio), we can temptatively consider the center of pull as Hensen's node, and the two stressed areas anterior and posterior, as the presumptive primitive streak, and presumptive embryo body (horizontal gray lobes in . A likely reason why they undergo differente fates after cracking is in that the anterior part is not delaminated.
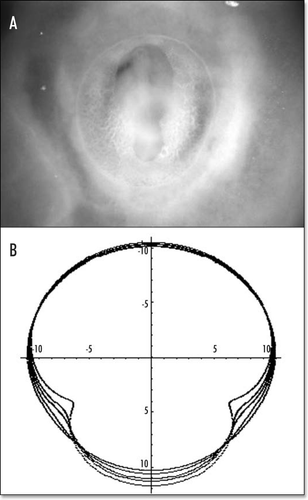
Figure 14 (A) A typical eight shaped area pellucida seen in the center of the yolk sac, surrounding the embryo, at day 1. The head is towards the top (12 o'clock), the tail towards the bottom. Blood islands are visible in the yolk sac The arteries will form the next day in the region of the nip of the eight. (Image courtesy of Lenoble F, U. Maastricht). (B) A typical theoretical blastodisc shape, if several deformation steps are performed (the AP axis is horizontal). A sector of the circle is actually sucked towards the nip where Kohler's sickle is exerting its force, while the tail extends caudaly. In this picture, the blastodisc adopts progressively an eight shape with a singular region in the region of the nip of the eight. In the center of this nip, one finds the center of the vortices seen in Figure 6B and C. This may be the origin of the prepattern of vitteline arteries. However, the calculated pattern is not as elongated as observed. In the actual embryo, there is obviously an additional extension in the AP direction, which is absent from this model. If we assume that this additional deformation does not change the global topology of the problem (mere change in aspect ratio), we can temptatively consider the center of pull as Hensen's node, and the two stressed areas anterior and posterior, as the presumptive primitive streak, and presumptive embryo body (horizontal gray lobes in Figure 9C. A likely reason why they undergo differente fates after cracking is in that the anterior part is not delaminated.

Figure 15 Correspondence between the stress map during gastrulation, and the eventual pattern of blood vessels. The black lobe corresponds to strong tension in x, the gray correspond to strong compression in y, the lower lobe leads to the primitive streak and mesoderm ingression, the upper lobe to embryo axis, and the perpendicular lines to vitelline arteries.
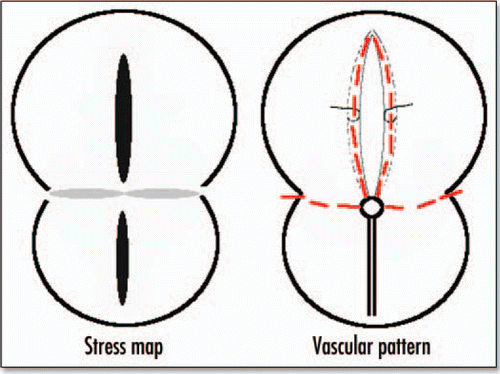
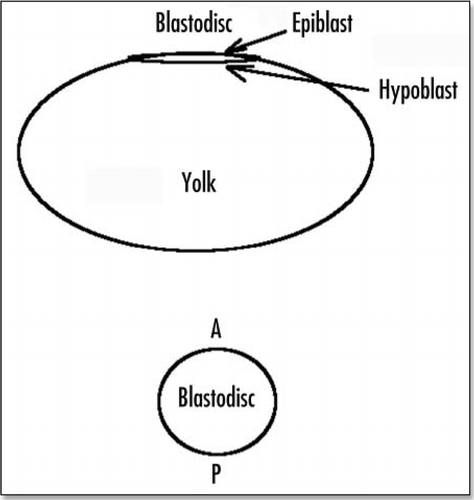
Figure 15 Correspondence between the stress map during gastrulation, and the eventual pattern of blood vessels. The black lobe corresponds to strong tension in x, the gray correspond to strong compression in y, the lower lobe leads to the primitive streak and mesoderm ingression, the upper lobe to embryo axis, and the perpendicular lines to vitelline arteries.
Reprints and Corporate Permissions

Please note: Selecting permissions does not provide access to the full text of the article, please see our help page How do I view content?

To request a reprint or corporate permissions for this article, please click on the relevant link below:

Academic Permissions

Please note: Selecting permissions does not provide access to the full text of the article, please see our help page How do I view content?

Obtain permissions instantly via Rightslink by clicking on the button below:

If you are unable to obtain permissions via Rightslink, please complete and submit this Permissions form. For more information, please visit our Permissions help page.