Figures & data
Figure 1. Chimera formation. (A) RT-PCR confirmed that GFP+ cells prominently expressed mesodermal genes, Bra, Foxc1 and Osr1 whereas the ectodermal marker, Pax6, was more prominent in GFP- cells; NTC, no template control. (B–D) KRCs (blue) from E13.5 metanephroi (B), ESCs (orange) (C) and FACS-sorted Bra+ (green) or Bra- (yellow) cells (D) were dissociated to single cells and labeled with QDs (thus becoming red cells) and mixed with unlabeled KRCs (blue) in a ratio of 1 to 8 prior to re-aggregation.
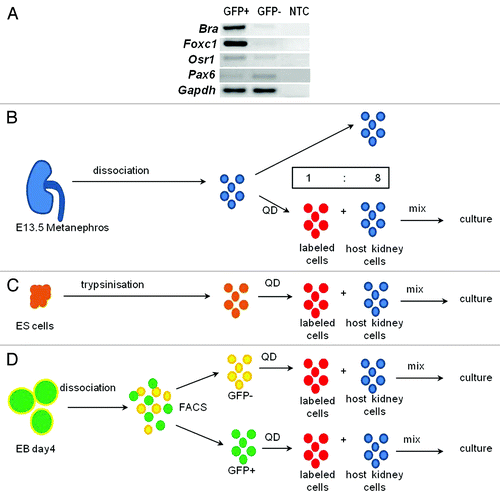
Figure 2. Effect of exogenous cells on chimera development. (A) Photomicrographs of Wt1 immunostained rudiments. (B) Graph showing explant areas. All chimeric rudiment areas are significantly different from the control (KRC chimera) (p < 0.05). (C) Left panel shows a confocal image of a day 3 KRC chimera immunostained for Wt1 (green) and laminin (blue). Schematic in right panel indicates developing nephron structures (DN), basement membrane (BM) and other tubules (OT), which comprise nephron tubules and UB branches. (D and E) Graphs showing numbers of developing nephrons per unit area (D) and areas of these structures (E). In D and E, while ESC and Bra- are significantly different from the KRC control chimeras (p < 0.05), there is no significant difference between Bra+ chimeras and controls (p > 0.05). In B, D and E, each point represents data from a single explant, with mean and standard error shown for each group. Note that the number and size of developing nephrons in KRC and Bra+ chimeras were similar, whereas ESC chimeras had significantly higher numbers of developing nephrons that had a smaller cross-sectional area. When organs were made with Bra- cells, they were generally very small and contained only a few, small nephrons. Scale bars in (A), 500 µm.
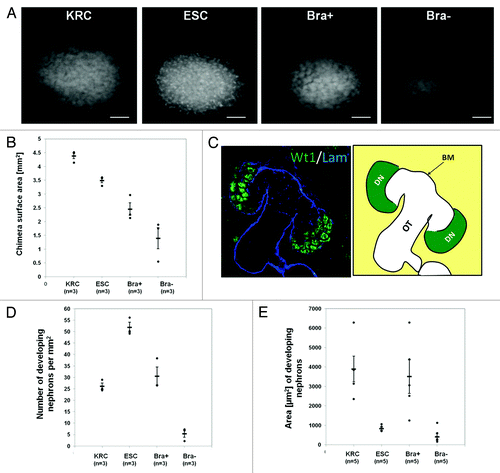
Table 1. Markers used to identify renal cell populations
Figure 3. Segment-specific markers in intact and recombinant chimeric metanephroi. The expression patterns of Six2 (nuclear signal, green), calbindin-28 (cytoplasmic signal, blue), Wt1 (nuclear signal, green) and synaptopodin (cytoplasmic signal, green) as well as apical LTA binding (green) in intact metanephric kidneys (left hand set of four panels) and in chimeric rudiments generated by mixing host cells with either KRC, ESC or Bra+ exogenous cells. Laminin staining is shown in white. Rudiments in the top two panels were analyzed after 3 d culture, whereas those in the bottom two panels were analyzed after 5 d culture. Scale bars, 75 µm.
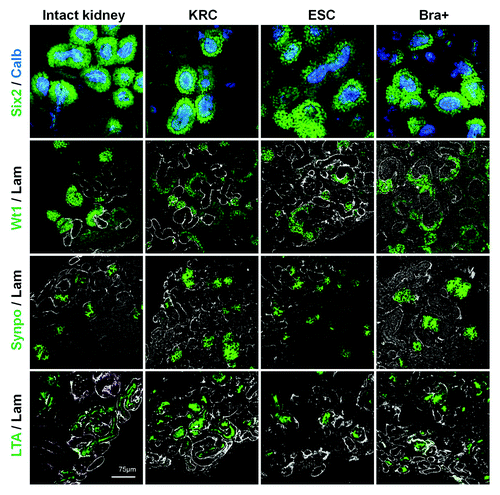
Figure 4. Expression of Oct4. (A) RT-PCR for Oct4 in undifferentiated ESCs, Bra+ (GFP+) cells and KRCs. Note that undifferentiated ESC and Bra+ cells express Oct4 just before being introduced into the chimera, whereas KRCs do not; NTC, no template control. (B) Oct4 (green nuclei) and laminin (white BMs) immunostaining within chimeras containing ESCs or Bra+ cells. Chimeric organs at day 0 were fixed 2–3 h following re-aggregation. Note plentiful large Oct4+ colonies in ESC chimeras. In contrast, there is a paucity of Oct4+ cells in the Bra+ chimeras. Scale bars, 60 μm
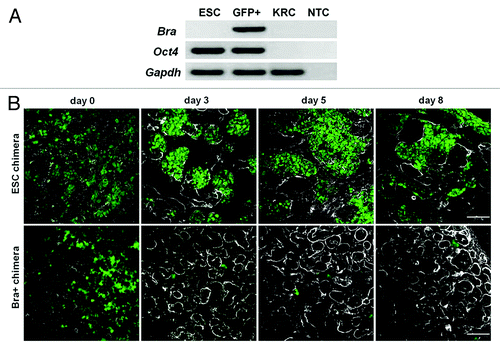
Figure 5. QD+ cell quantification. (A) Graph presenting the extent of integration of labeled cells into developing nephrons and other tubules per unit area (0.84 mm2). Numbers of QD+ cells in KRC and Bra+ chimeras (n = 3 organs for each) within developing nephrons was not significantly different, but the numbers in ESC chimeras was significantly less (p < 0.05). (B) Percentages of QD+ cells contributing to developing nephrons. Note that significantly fewer labeled cells contributed to developing nephrons (p < 0.05) in ESC chimeras vs. the other groups (n = 3 rudiments analyzed for each group, and for each rudiment six nephrons were analyzed).
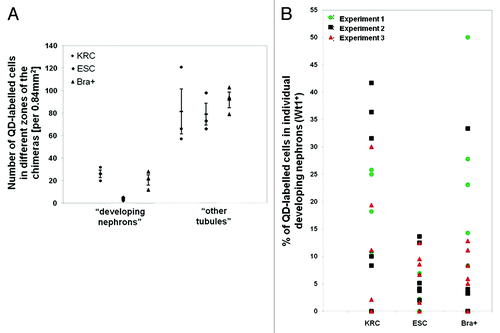
Figure 6. Expression of kidney specific markers by QD+ cells in chimeras. Representative confocal photomicrographs showing the expression of different markers in chimeras made with KRC, ESC and Bra+ cells. Yellow arrows point to QDs within specific cells. Boxed areas outlined in white are presented as enlargements within the main frame of some of the images. Note that QD+ cells are not seen in Six2, Wt1, synaptopodin and LTA (all in green) positive regions in the ESC chimera vs. the presence of QDs in these regions within rudiments made with Bra+ and positive control KRC cells. Basement membrane structures are stained with laminin (white). Scale bar, 20 μm.
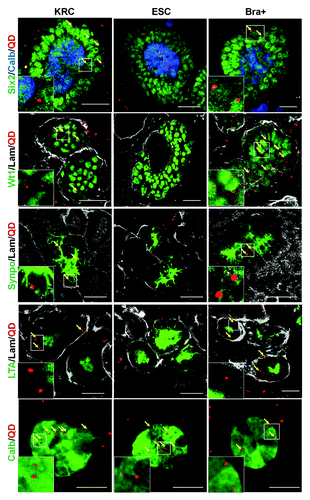
Figure 7. Uptake of organic ions by E13.5 intact kidney rudiments. In the absence of the OAT inhibitor, probenecid, vital staining of intact E13.5 kidney rudiments with 6-CF (green), indicates uptake by tubular epithelial cells. Uptake of 6-CF is blocked in the presence of probenecid. Vital staining with PNA (red) was used to identify tubule BMs. The rudiments had been cultured for 5 d prior to staining. Scale bars, 100 μm.
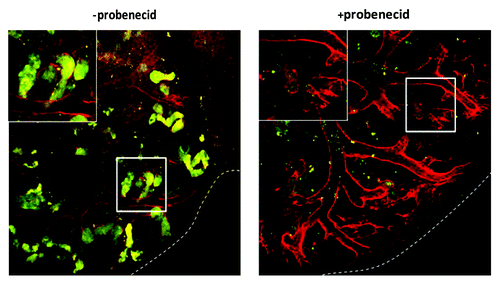
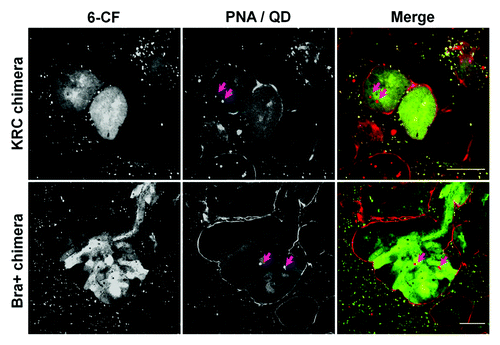
Figure 8. QD+ ESC-derived mesodermal cells take up organic ions. KRC and Bra+ chimeric organs contain QD+ (arrowed) cells which take up 6-CF. For each type of chimeric organ, the following images are shown of the same field: from left to right, the first image shows 6-CF, the second image shows PNA/QDs, and the third frame is a merged, color image (6-CF in green and PNA/QDs in red). Scale bars, 20 μm.