Figures & data
Figure 1 (A and B) Phase contrast photomicrographs of either (A) mIMCD cells or (B) MDCK cells cocultured for 48 hr with the ed11.5–12.5 embryonic murine kidney (EK) as a source of soluble growth factors. Both cell types are induced to form complex branching tubular structures in the presence of the soluble factors secreted by the embryonic kidney (Bar = 50 µm). (From ref. Citation12).
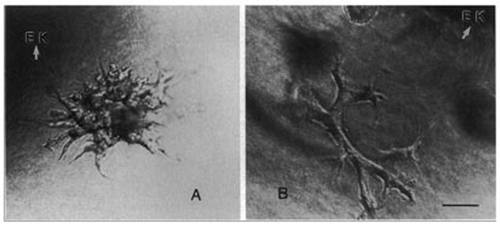
Figure 2 (A and B) Phase contrast photomicrographs of 3D cultures of either (A) mIMCD cells or (B) ureteric bud (UB) cells grown for 48 hr. The cells were grown in the presence of either 3t3 cell conditioned medium (A—source of HGF) or BSN cell conditioned medium supplemented with 0.5% FBS (Bar = 25 µm). (From ref. Citation39).
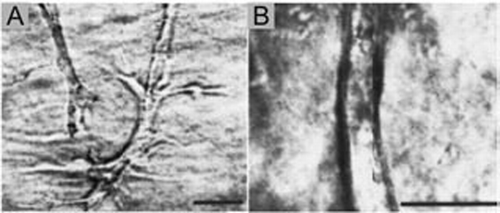
Figure 3 (A–C) Phase contrast photomicrographs of either (A) isolated whole mesonephros, including the Wolffian duct, (B) isolated WD in which the mesonephric tubules, along with most of the non-epithelial mesoderm is removed or (C) isolated WD cleared of all surrounding mesoderm before in vitro culture (“naked” epithelial tube) suspended within a 3D extracellular matrix gel. The cultures were grown for 3 days in either (A and B) DME/F12 supplemented with FBS and soluble grow factors [(A) 10 ng/ml GDNF; (B) 125 ng/ml GDNF and 250 ng/ml FGF1] or (C) BSN conditioned medium supplemented with 125 ng/ml GDNF and 250 ng/ml FGF1 ; (Scale bar: 500 µm.) (From ref. Citation20).
![Figure 3 (A–C) Phase contrast photomicrographs of either (A) isolated whole mesonephros, including the Wolffian duct, (B) isolated WD in which the mesonephric tubules, along with most of the non-epithelial mesoderm is removed or (C) isolated WD cleared of all surrounding mesoderm before in vitro culture (“naked” epithelial tube) suspended within a 3D extracellular matrix gel. The cultures were grown for 3 days in either (A and B) DME/F12 supplemented with FBS and soluble grow factors [(A) 10 ng/ml GDNF; (B) 125 ng/ml GDNF and 250 ng/ml FGF1] or (C) BSN conditioned medium supplemented with 125 ng/ml GDNF and 250 ng/ml FGF1 ; (Scale bar: 500 µm.) (From ref. Citation20).](/cms/asset/ec28b221-f111-496a-8bd5-638838cd598c/kogg_a_10906498_f0003.gif)
Figure 4 (A–E) Phase-contrast photomicrographs of UBs isolated from ed13 embryonic rat kidney and cultured for up to 5 days in BSN conditioned media supplemented with 10% FBS and soluble growth factors (125 ng/ml GDNF and 250 ng/ml FGF-1). (From ref. Citation36).

Figure 5 (A–C) Phase contrast photomicrographs demonstrating the ability of in vitro formed UBs (induced from an isolated WD) to undergo branching morphogenesis in 3D cultures. (A) Isolated WD cultured for 4 days in DME/F12 supplemented with 125 ng/ml GDNF and 250 ng/ml FGF1 to induce the emergence of supernumerary UBs. (B and C) A single in vitro formed UB (circle in A) was excised, suspended within a 3D extracellular matrix gel (1:1 Matrigel/DME-F12) and cultured in BSN conditioned medium supplemented with 10% FBS, 125 ng/ml GDNF and 250 ng/ml FGF1. (From ref. Citation20).
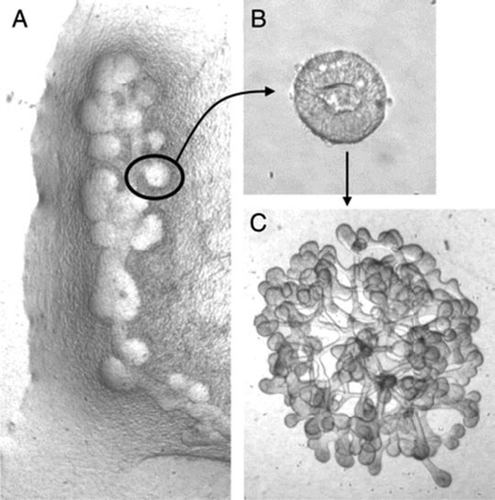
Figure 6 (A and B) Phase contrast photomicrographs demonstrating the ability to microdissect and propogate cultured isolated rat embryonic UBs. (A) UB cultured for 7 days in BSN conditioned medium (supplemented with 10% FBS, 125 ng/ml GDNF and 250 ng/ml FGF1) were dissected and subdivided into thirds and resuspended within 3D ECM gels. This subdivided UBs were cultured for an additional 8 days using the same culture conditions. (B) One of these second generation cultured was further subdivided, resuspended and cultured for an additional 8 days in BSN conditioned media (supplemented with 10% FBS, 125 ng/ml GDNF and 250 ng/ml FGF1). (C) A schematic representation of the procedure for isolated UB propagation indicates the potential for generating a large number of UBs from a single progenitor UB. (From ref. Citation30).
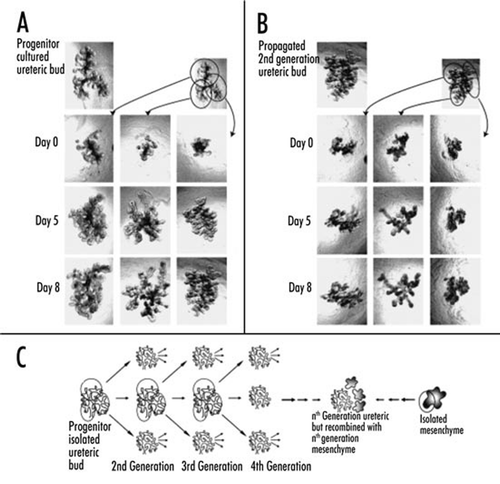
Figure 7 (A–C) Confocal fluorescent micrographs of kidney-like tissue engineered from the recombination of cultured UB (red—UB-derived tubules are stained with TRITC-conjugated D. biflorus,) and freshly isolated metanephric mesenchyme (7 days after recombination). The accumulation of 6-CF (green—a fluorescent organic anion which is transported via the basolaterally localized organic anion transporters of the proximal tubule) in the MM-derived tubules of the recombined tissue indicates that structural and functional differentiation of the mesenchyme is occurring. (B and C) The accumulation is seen only in the cells of non-UB-derived tubules (arrows) and is inhibited by probenecid- (a competitive inhibitor of organic anion transport) [Scale bars: (A and C), 500 µm; (B), 200 µm]. (From ref. Citation20).
![Figure 7 (A–C) Confocal fluorescent micrographs of kidney-like tissue engineered from the recombination of cultured UB (red—UB-derived tubules are stained with TRITC-conjugated D. biflorus,) and freshly isolated metanephric mesenchyme (7 days after recombination). The accumulation of 6-CF (green—a fluorescent organic anion which is transported via the basolaterally localized organic anion transporters of the proximal tubule) in the MM-derived tubules of the recombined tissue indicates that structural and functional differentiation of the mesenchyme is occurring. (B and C) The accumulation is seen only in the cells of non-UB-derived tubules (arrows) and is inhibited by probenecid- (a competitive inhibitor of organic anion transport) [Scale bars: (A and C), 500 µm; (B), 200 µm]. (From ref. Citation20).](/cms/asset/67099385-8f6c-4ab8-b35c-737794cedfca/kogg_a_10906498_f0007.gif)
Figure 8 Schematic of a proposed strategy for bioengineering kidneys from in vitro models of kidney development. Initially, supernumerary UBs are induced from the isolated WD. Potentially each of these buds can be isolated and propagated to form multiple branched UBs in 3D ECM gels; each of which can then be recombined with freshly isolated MM. Following a period of mutual induction (i.e., 4–7 days), the recombined tissue (which now resembles a late-stage embryonic kidney) is then implanted into a host animal where it vascularizes and forms glomeruli. The possible use of cultured cells to engineer progenitor tissues (i.e., WD, UB and/or MM-like tissue) is also indicated. (From ref. Citation20).
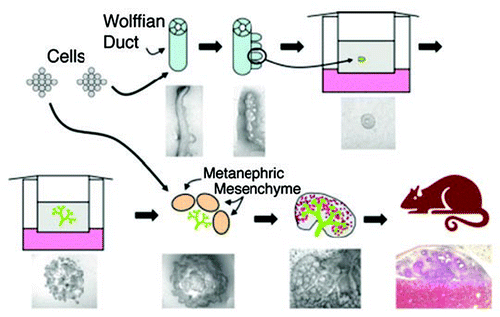
Figure 9 Clustergram [made using the hierarchical clustering algorithm, GENESPRING (Silicon Genetics)] showing the grouping of 873 genes whose expression changed significantly at some point in rat kidney development using Affymetrix cDNA microarray genechips. Genes were identified using RNA isolated from a time series of kidney development [i.e., ed13, ed15, ed17, ed19, newborn (N), 1 week postpartum (W) and adult (A) kidneys] and clustered in two dimensions according to their gene expression and experimental vectors in Euclidian space after compressing the equalized data to a target maximum value of 3. K-means clustering revealed 5 distinct groups of gene expression patterns within the clustergram (numbers at the bottom) depending on their time-frame of expression. (From ref. Citation35).
![Figure 9 Clustergram [made using the hierarchical clustering algorithm, GENESPRING (Silicon Genetics)] showing the grouping of 873 genes whose expression changed significantly at some point in rat kidney development using Affymetrix cDNA microarray genechips. Genes were identified using RNA isolated from a time series of kidney development [i.e., ed13, ed15, ed17, ed19, newborn (N), 1 week postpartum (W) and adult (A) kidneys] and clustered in two dimensions according to their gene expression and experimental vectors in Euclidian space after compressing the equalized data to a target maximum value of 3. K-means clustering revealed 5 distinct groups of gene expression patterns within the clustergram (numbers at the bottom) depending on their time-frame of expression. (From ref. Citation35).](/cms/asset/68f207b3-84c3-4d19-b16d-0a578dc354e6/kogg_a_10906498_f0009.gif)
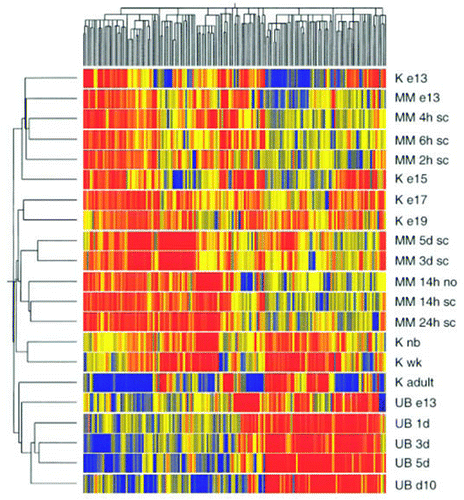
Figure 10 Clustergram showing the grouping of differentially expressed genes from cultures of isolated UB and isolated MM together with genes from whole kidney development data. The genes were clustered in two dimensions according to their gene expression. Designations on the right side of cluster-gram refer to the tissue from which the genes were identified. Abbreviations are: K, kidney; e13, e15, e17, e19, day of embryonic gestation; nb, newborn; wk, 1 week postpartum; sc, spinal cord; no, no spinal cord. Red represents upregulated; blue represents downregulated. (From ref. Citation36).
