381
Views
5
CrossRef citations to date
0
Altmetric
Review Series: Fetal Programming

Blood pressure follows the kidney

Perinatal influences on hereditary hypertension

, &
Pages 153-157 | Published online: 23 Jul 2008

Figures & data

Figure 1 The proposed four components of development of hereditary hypertension (A) and how blood pressure regulation could be programmed during perinatal development (B).
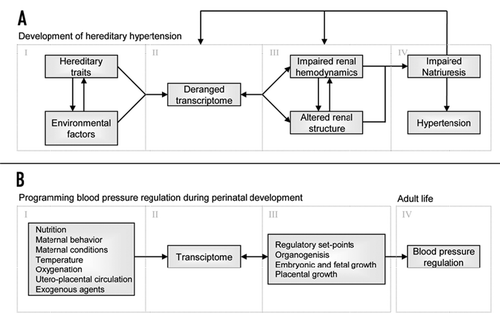
Figure 1 The proposed four components of development of hereditary hypertension (A) and how blood pressure regulation could be programmed during perinatal development (B).

Figure 2 Urinary excretions of stable NO metabolites in 4 week-old SHR (open bar) and WKY (horizontal striped bar). #p < 0.001 vs. SHR.
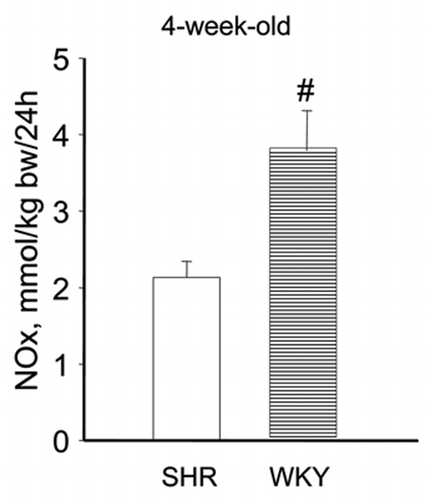
Figure 2 Urinary excretions of stable NO metabolites in 4 week-old SHR (open bar) and WKY (horizontal striped bar). #p < 0.001 vs. SHR.

Figure 3 NO yields in kidney (A) and heart (B) determined by electron paramagnetic resonance in SHR (open bars), SHR perinatally supplemented with citrulline (SHRcitr; diagonally striped bars) and WKY (horizontal striped bar).Citation46 p < 0.05, p < 0.01 and #p < 0.001 vs. SHR.

Figure 3 NO yields in kidney (A) and heart (B) determined by electron paramagnetic resonance in SHR (open bars), SHR perinatally supplemented with citrulline (SHRcitr; diagonally striped bars) and WKY (horizontal striped bar).Citation46 †p < 0.05, ‡p < 0.01 and #p < 0.001 vs. SHR.
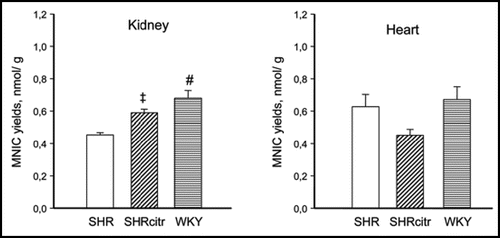
Figure 4 Systolic blood pressure (A) in control SHR (open circles; n = 24) and SHRcitr (closed circles; n = 16) and WKY (triangles; n = 9).Citation46 WKY was lower than SHR from 8 weeks onwards (p < 0.001). Mean arterial pressure (MAP) at 50 weeks of age (B) in SHR (open bars), SHRcitr (diagonally striped bars) and WKY (striped bars). p < 0.05, #p < 0.001 vs. SHR.

Figure 4 Systolic blood pressure (A) in control SHR (open circles; n = 24) and SHRcitr (closed circles; n = 16) and WKY (triangles; n = 9).Citation46 WKY was lower than SHR from 8 weeks onwards (p < 0.001). Mean arterial pressure (MAP) at 50 weeks of age (B) in SHR (open bars), SHRcitr (diagonally striped bars) and WKY (striped bars). †p < 0.05, #p < 0.001 vs. SHR.
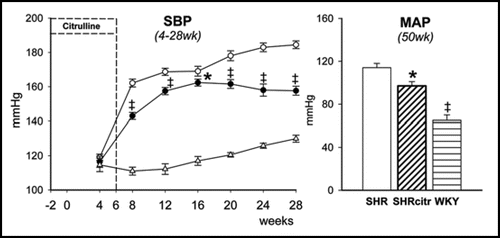
Table 1 Glomerular diameter glomerular density, and kidney weight (mean left and right) of male control and postnatal low-protein (PLP) rats at 12 months of age)

Reprints and Corporate Permissions

Please note: Selecting permissions does not provide access to the full text of the article, please see our help page How do I view content?

To request a reprint or corporate permissions for this article, please click on the relevant link below:

Academic Permissions

Please note: Selecting permissions does not provide access to the full text of the article, please see our help page How do I view content?

Obtain permissions instantly via Rightslink by clicking on the button below:

If you are unable to obtain permissions via Rightslink, please complete and submit this Permissions form. For more information, please visit our Permissions help page.