Figures & data
Figure 1 Summary of experimental protocol used to determine the effect of delivery temperature and maternal dexamethasone administration on the abundance of mRNA and mitochondrial proteins in perirenal adipose tissue of the neonatal lamb. dGA; days of gestation, term ∼147 dGA.
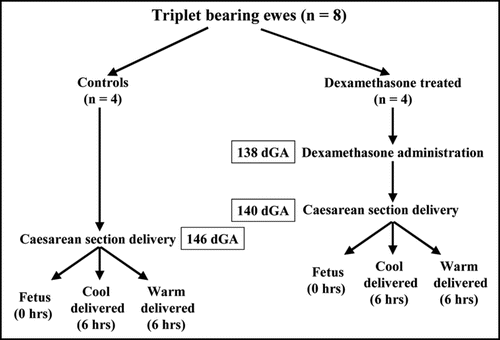
Figure 2 Abundance of (A) uncoupling protein (UCP)-1 mRNA, (B) UCP2 mRNA, (C) glucocorticoid receptor (GR) mRNA and (D) 11β-hydroxysteroid dehydrogenase type 1 (11βHSD1) mRNA in perirenal adipose tissue sampled from fetuses delivered by caesarean section at 140 days of gestation (dGA; term ∼147 dGA) following maternal dexamethasone (Dex) administration or at 146 dGA (control group) into warm and cool ambient temperatures. Example images of gene mRNA expression are given. Values are means with their standard errors (n = 4 per individual group). *p < 0.05, **p < 0.01, mean value significantly different from respective control group.
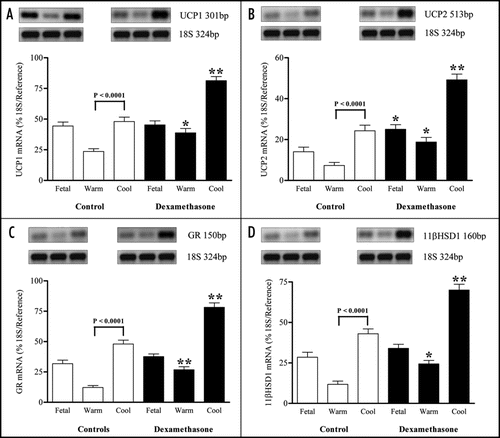
Figure 3 Abundance of (A) voltage-dependent anion channel (VDAC) and (B) cytochrome c proteins in perirenal adipose tissue sampled from fetuses delivered by caesarean section at 140 days of gestation (dGA; term ∼147 dGA) following maternal dexamethasone (Dex) administration or at 146 dGA (control group) into warm and cool ambient temperatures. Examples of protein expression are given. Values are means with their standard errors (n = 4 per individual group). ** P < 0.01, mean value significantly different from respective control group.
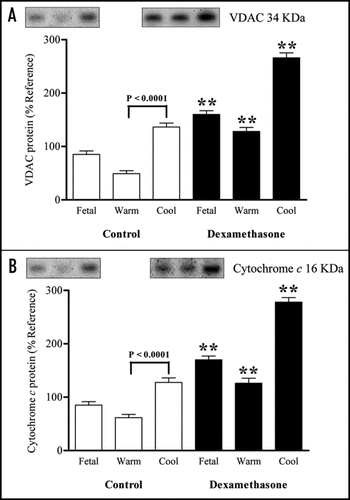
Figure 4 Abundance of interleukin 6 mRNA in perirenal adipose tissue sampled from fetuses delivered by caesarean section at 140 days of gestation (dGA; term ∼147 dGA) following maternal dexamethasone (Dex) administration or at 146 dGA (control group) into warm and cool ambient temperatures. Values are means with their standard errors (n = 4 per individual group).
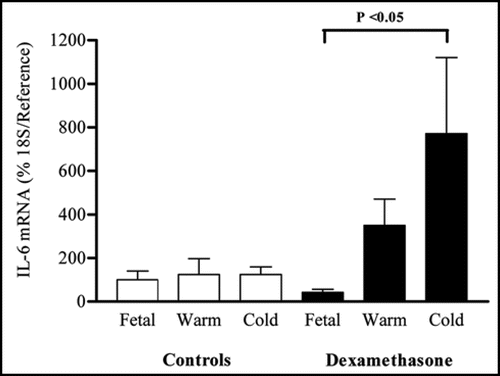
Table 1 Effect of maternal dexamethasone administration on maternal plasma hormones and metabolites
Table 2 Significant negative relationship between plasma cortisol concentration and molecular measurements made in perirenal adipose tissue sampled from fetuses and neonates delivered by caesarean section into warm and cool ambient temperatures at either 140 days gestation following maternal dexamethasone administration or at 146 days (Controls) (n = 24)
Table 3 Significant positive relationship between plasma non-esterified fatty acid concentration relationships between molecular measurements made in perirenal adipose tissue sampled from fetuses and neonates delivered by caesarean section into warm and cool ambient temperatures at either 140 days gestation following maternal dexamethasone administration or at 146 days (Controls) (n = 24)
Table 4 Significant positive relationships between molecular measurements made in perirenal adipose tissue sampled from fetuses and neonates delivered by caesarean section into warm and cool ambient temperatures at either 140 days gestation following maternal dexamethasone administration or at 146 days (Controls) (n = 24)