Figures & data
Figure 1 (A) Perfusion protocol for renal survival after vitrification and rewarming. M, molarity; A-V (M), arteriovenous difference in molarity; T, temperature in degrees Celsius. The protocol, as usual,Citation6,Citation39 employs an initial 5 M plateau, a second plateau at 8.4 M to allow cooling to −22°C without freezing, and a final plateau during M22 perfusion. In the experiment shown, the perfusion was interrupted at the point shown to enable the kidney to be vitrified, rewarmed and reperfused with 8.4 M cryoprotectant at −3°C. (B) Thermal history of the transplanted kidney based on invasive temperature measurements in a model rabbit kidney cooled and rewarmed by a procedure identical to that used for the vitrified-transplanted rabbit kidney. Line 1: inner medullary temperature, as documented by a thermocouple located 1.2 cm below the renal surface; line 2: outer medullary temperature, measured 7 mm below the renal surface; line 3: cortical temperature 2 mm below the renal surface; line 4: environmental temperature of the test kidney; line 5: environmental temperature of the kidney that was transplanted after previous vitrification. TM,IM, estimated melting point of inner medullary tissue (upper horizontal line); TG, estimated glass transition temperature of inner medullary tissue (lower horizontal line).
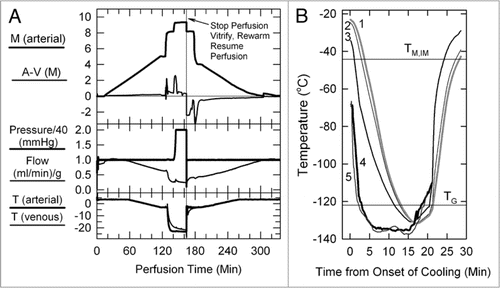
Figure 2 (A) Changes in blood levels of hemoglobin and potassium after transplantation of a previously vitrified rabbit kidney and interventions to correct both (triangles). Hyperkalemia was corrected by intravenous glucose (20 ml of 5% dextrose in 0.45% NaCl) and insulin (0.4 ml of 1 U/ml, IV). Anemia was corrected with 20 ml of whole rabbit blood (∼6–8 ml/kg) on each occurrence. Blood levels were measured before corrective interventions given on the same day. [Hb], hemoglobin concentration in g/dl); [K+], potassium concentration in meq/l. (B) Postoperative creatinine levels and diuretic support history. Lower triangles indicate furosemide administration (generally 5–10 mg, IV or IM); upper triangles indicate hydration (generally 100–200 ml, consisting of equal volumes of 0.9% NaCl and 0.45% NaCl plus 5% glucose, subcutaneously). Blood levels were measured before corrective interventions given on the same day.
![Figure 2 (A) Changes in blood levels of hemoglobin and potassium after transplantation of a previously vitrified rabbit kidney and interventions to correct both (triangles). Hyperkalemia was corrected by intravenous glucose (20 ml of 5% dextrose in 0.45% NaCl) and insulin (0.4 ml of 1 U/ml, IV). Anemia was corrected with 20 ml of whole rabbit blood (∼6–8 ml/kg) on each occurrence. Blood levels were measured before corrective interventions given on the same day. [Hb], hemoglobin concentration in g/dl); [K+], potassium concentration in meq/l. (B) Postoperative creatinine levels and diuretic support history. Lower triangles indicate furosemide administration (generally 5–10 mg, IV or IM); upper triangles indicate hydration (generally 100–200 ml, consisting of equal volumes of 0.9% NaCl and 0.45% NaCl plus 5% glucose, subcutaneously). Blood levels were measured before corrective interventions given on the same day.](/cms/asset/07da3853-ef67-481d-a697-a88fcd25969d/kogg_a_10909974_f0002.gif)
Figure 3 (A) Cross-section of the vitrified/rewarmed kidney (PAS staining) showing surviving (S) and non-surviving (NS) medullary areas; white box designates the region depicted in (B), and black box identifies the location of (C). Non-surviving areas are confined to one side of the kidney. Scale bars: in (A), 3 mm; in (B and C), 100 microns.
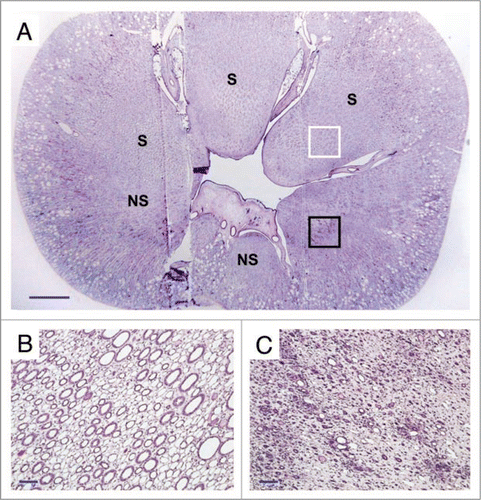
Figure 4 The spectrum of renal cortical responses to vitrification and rewarming. Top: area showing predominant survival of both tubules and glomeruli. Scale bars all represent 100 microns. Middle: transitional zone between predominantly surviving superficial renal cortex and non-surviving cortex, showing loss of tubules but survival of glomeruli. Bottom: non-surviving superficial cortex, showing loss of both tubules and glomeruli, with ballooning of Bowman's capsule. PAS stain.
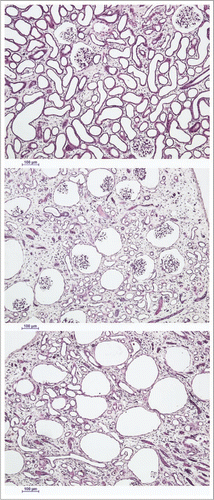
Figure 5 Difference between the venous concentration and the urinary space concentration during M22 perfusion at −22°C and 40 mmHg (n = 4 perfusions). Urine concentrations (discreet data points ±1 SeM) determined manually; venous concentrations (line with gray “halo” consisting of ±1 SeM) determined by computer. the time base gives time from the nominal onset of M22 perfusion, with includes a lag time as M22 makes its way through the perfusion circuit. the horizontal line near the top of the graph shows the concentration of M22, which is not fully reached even by the venous effluent by the end of M22 delivery.
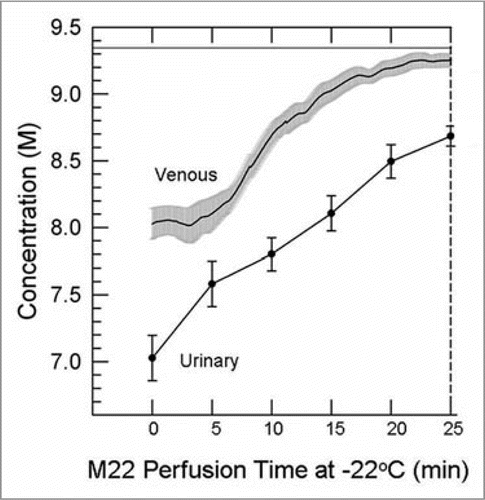
Figure 6 Equilibration shortfalls (urine concentration minus nominal arterial concentration) in rabbit kidneys perfused with M22 at −22°C (M22-22) or at −3°C (M22-3) plotted as a function of arterial flow rates (which decline as higher concentrations are reached and viscosity increases). M22NP-3 refers to M22 minus all polymers, perfused at −3°C; M22NP + 2X-3 refers to M22NP containing 2% X1000 ice blocker, perfused at −3°C. Values in parentheses indicate the number of perfusions of each type. Each data point represents urine equilibration measured at 5-min intervals, beginning at VS perfusion time zero to the right and ending at VS perfusion time = 25 min to the left. The horizontal lines are “landmark” concentrations and refer to the concentrations of VMP (2nd Plateau, which falls at a shortfall of −889 mM) and 95% of full-strength vitrification solution (VS) (which, because of the negligible molarity of the polymers of M22, is essentially the same for M22, M22NP and M22NP + 2X). error bars designate ±1 SEM. For discussion, see text.
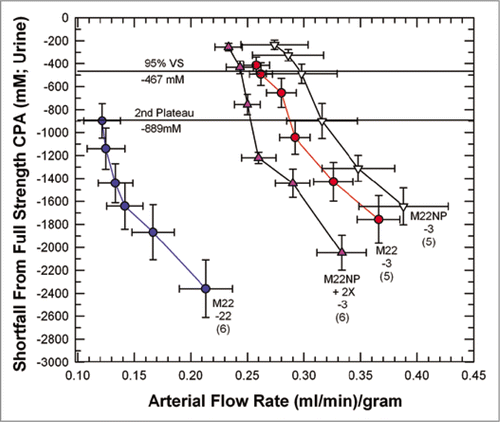
Figure 7 Left: urine accumulation during perfusion with M22, M22NP + 2% X1000 (NP + 2), and M22NP at −3°C; right: reciprocal viscosities of these three vitrification solutions (cP−1). the total accumulated urine volumes are inversely proportional to the total viscosity of each VS (M22 = 4.54 cP; M22NP + 2X = 3.71 cP; M22NP = 2.77 cP). the urine volume for M22 at 25 min was not consistently recorded and so is indicated by extrapolation. Data points represent means ±1 SEM.
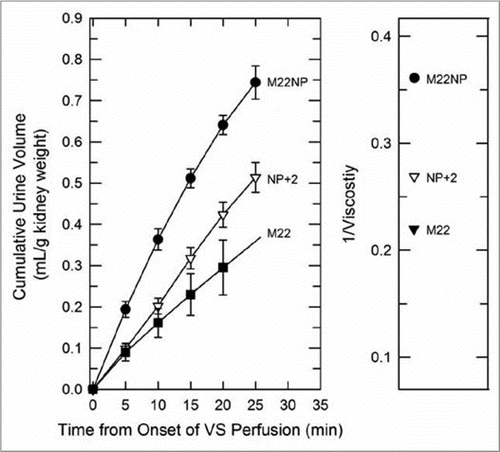
Figure 8 Temperature, extent and warming rate dependence of ice formation in urine (left) and tissue samples (right) obtained from kidneys subjected to the four protocols of and relationship between the amount of ice formed during devitrification and the amount of ice that thawed upon complete rewarming. Urine was not collected from the M22 kidneys perfused at −22°C. Upper: devitrification temperatures (TD); middle: the percentage of sample mass that crystallizes during devitrification; lower: the percentage of sample mass that melts upon continued warming. each point represents the mean of generally 5–6 independent measurements; devitrification temperatures are averaged only for those samples that devitrified. No devitrification event was observed for any specimen in the M22 −3°C group. Error bars omitted for clarity. Groups are represented as indicated in the inset. For discussion, see text.
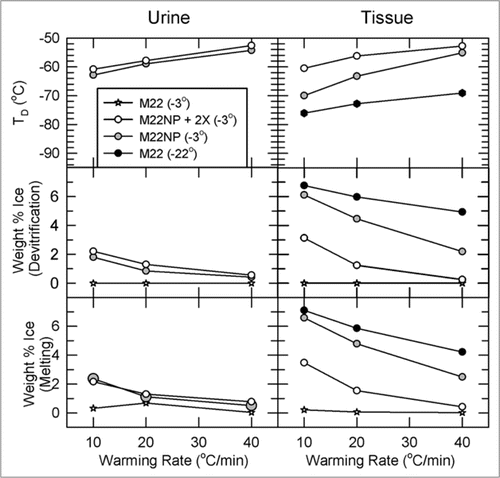
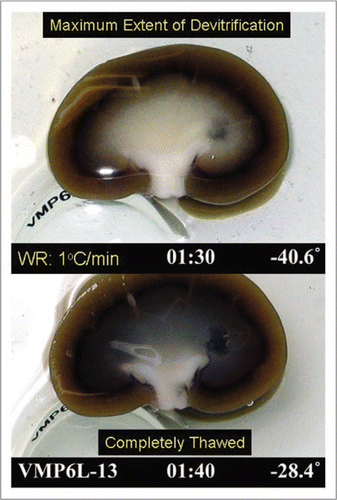
Figure 9 Visual appearance of ice in an exemplary rabbit kidney cross-section during rewarming. the kidney was perfused with M22 at −22°C, cut in half, immersed in M22, vitrified in a CryoStar freezer at −135°C, and eventually rewarmed at about 1°C/min while being photographed from time to time. Rewarming was accomplished by transfer of the kidneys to an insulated box through which liquid nitrogen vapor was circulated slowly so as to allow steady warming of the contained atmosphere from just below Tg to well above the renal melting points. Times (1:30 and 1:40) represent times in hours and minutes since the onset of slow warming, and temperatures refer to ambient atmospheric temperatures near the kidney but not within the kidney itself. The upper panel shows the kidney at the point of maximum ice cross-sectional area, and the lower panel shows the kidney after complete ice melting. Both panels show the site of an inner medullary biopsy taken for differential scanning calorimetry.
