408
Views
11
CrossRef citations to date
0
Altmetric
Research Paper: Imaging

Watching the assembly of an organ a single cell at a time using confocal multi-position photoactivation and multi-time acquisition

, , , &
Pages 238-247 | Published online: 01 Oct 2009

Figures & data

Figure 1 In ovo single cell photoactivation. (A) An E3.5 chick embryo 16 hours post in ovo microinjection and electroporation with H2B-PSCFP2 in the hindbrain and fixed for 1 hour before mounting on a glass coverslip. The black box outlines the unphotoactivated fluorescence (pink) and photoactivated (green) cells in the neural tube and migrating neural crest cells from rhombomere 6 (r6) and r7 regions. The photoactivated fluorescence (green) was created using a 405 nm laser, 10% laser power. (B) Single cell photoactivation can be challenging if the protein is diffuse throughout the cytoplasm and if the location of the cell is in a densely labeled population. Two cells with PSCFP2 have been photoactivated (green) and unphotoactivated cells are blue. The top cell (arrow) was photoactivated with 2-photon photoactivation at 770 nm, 7% laser power. The bottom cell (arrowhead) was photoactivated with confocal laser excitation at 405 nm. (B′) The X–Z scan, zoomed in from the white box, show a single cell photoactivated with a 2-photon laser (arrow in B) and 2–3 cells photoactivated with a 405 nm (arrowhead in B) inside the neural tube. (C) The line profile through the two photoactivated cells of the X–Z scan in (B′) compares the fluorescence intensity of the 2-photon (arrow in B) and the 405 nm (arrowhead in B) photoactivated cells by recording of the log (base10) ratio of the mean fluorescence intensity ratio (I/Io) of photoactivated to non-photoactivated fluorescence. (D) An area of cells expressing H2B-PSCFP2 pre-photoactivation (pink) and (D′) after the exposure of a 405 nm laser the single cell in the center becomes photoactivated (green). (E) The dense tissue of the neural tube is labeled with H2B-PSCFP2 with both unphotoactivated (blue) and photoactivated (green) cells. The localization in the nucleus helps distinguish individual cells for targeted photoactivation. (F) The X–Z projection of the photoactivated nuclei shown in isosurface reveals several nuclei surrounding the targeted cells. (G) The photoefficiency of PSCFP2 is maintained after localizing to the nucleus using 10% laser power of a 25 mW 405 nm laser over 9 minutes of scanning. The curves are an average of n = 4 mean intensities of cells for PSCFP2 (blue line) and H2B-PSCFP2 (green line).
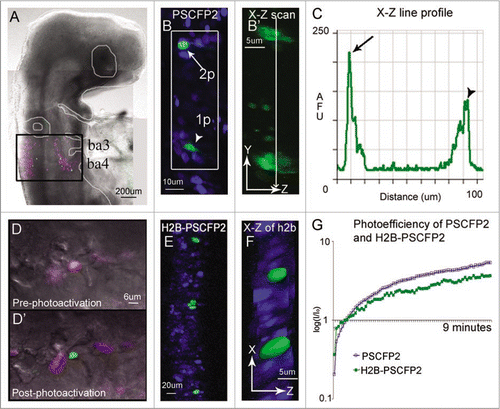
Figure 1 In ovo single cell photoactivation. (A) An E3.5 chick embryo 16 hours post in ovo microinjection and electroporation with H2B-PSCFP2 in the hindbrain and fixed for 1 hour before mounting on a glass coverslip. The black box outlines the unphotoactivated fluorescence (pink) and photoactivated (green) cells in the neural tube and migrating neural crest cells from rhombomere 6 (r6) and r7 regions. The photoactivated fluorescence (green) was created using a 405 nm laser, 10% laser power. (B) Single cell photoactivation can be challenging if the protein is diffuse throughout the cytoplasm and if the location of the cell is in a densely labeled population. Two cells with PSCFP2 have been photoactivated (green) and unphotoactivated cells are blue. The top cell (arrow) was photoactivated with 2-photon photoactivation at 770 nm, 7% laser power. The bottom cell (arrowhead) was photoactivated with confocal laser excitation at 405 nm. (B′) The X–Z scan, zoomed in from the white box, show a single cell photoactivated with a 2-photon laser (arrow in B) and 2–3 cells photoactivated with a 405 nm (arrowhead in B) inside the neural tube. (C) The line profile through the two photoactivated cells of the X–Z scan in (B′) compares the fluorescence intensity of the 2-photon (arrow in B) and the 405 nm (arrowhead in B) photoactivated cells by recording of the log (base10) ratio of the mean fluorescence intensity ratio (I/Io) of photoactivated to non-photoactivated fluorescence. (D) An area of cells expressing H2B-PSCFP2 pre-photoactivation (pink) and (D′) after the exposure of a 405 nm laser the single cell in the center becomes photoactivated (green). (E) The dense tissue of the neural tube is labeled with H2B-PSCFP2 with both unphotoactivated (blue) and photoactivated (green) cells. The localization in the nucleus helps distinguish individual cells for targeted photoactivation. (F) The X–Z projection of the photoactivated nuclei shown in isosurface reveals several nuclei surrounding the targeted cells. (G) The photoefficiency of PSCFP2 is maintained after localizing to the nucleus using 10% laser power of a 25 mW 405 nm laser over 9 minutes of scanning. The curves are an average of n = 4 mean intensities of cells for PSCFP2 (blue line) and H2B-PSCFP2 (green line).

Figure 2 Multi-position photoactivation set up. (A) Transverse section of E4 trunk tissue with neural tube outlined in white. Dorsoventral length (L) and one-half of medioventral width (W) of the neural tube were measured to calculate the approximate ROI size necessary to cover the entire length of half the neural tube. (B) Multi-position mark and find alignment schematic of ROI's, placed in consecutive sections with an increasing position along the dorsoventral axis, green rectangular boxes. (C–H) Collapsed z-stacks of each slice (6 slices from one embryo), with and without brightfield for clarity, after the ROI's were photoactivated. Slices shown based on the placement of the photoactivated regions in serial sections. (I) Chronological breakdown of the time requirements are necessary for set-up, photoactivation and z-stack in one position. Dor, dorsal;Ven, ventral; NT, neural tube; L, length;W, width; ROI's, regions of interest. The scale bar in (C) is 100 um.
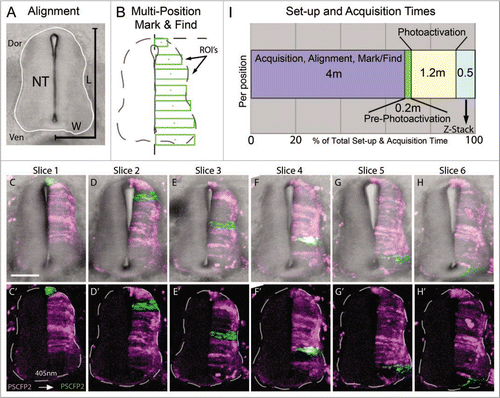
Figure 2 Multi-position photoactivation set up. (A) Transverse section of E4 trunk tissue with neural tube outlined in white. Dorsoventral length (L) and one-half of medioventral width (W) of the neural tube were measured to calculate the approximate ROI size necessary to cover the entire length of half the neural tube. (B) Multi-position mark and find alignment schematic of ROI's, placed in consecutive sections with an increasing position along the dorsoventral axis, green rectangular boxes. (C–H) Collapsed z-stacks of each slice (6 slices from one embryo), with and without brightfield for clarity, after the ROI's were photoactivated. Slices shown based on the placement of the photoactivated regions in serial sections. (I) Chronological breakdown of the time requirements are necessary for set-up, photoactivation and z-stack in one position. Dor, dorsal;Ven, ventral; NT, neural tube; L, length;W, width; ROI's, regions of interest. The scale bar in (C) is 100 um.

Figure 3 Multi-position photoactivation and multi-time acquisition. (A) A typical fluorescently labeled (PSCFP2) chick embryo at day 4 with (B) the spinal cord removed and (C) cut into slice preparations that (D) are laid onto a culture insert. (E) Within each tissue slice, a region of interest is photoactivated and set up for time-lapse acquisition in a sequential manner, with three typical slice data shown at 0.5 hr, 4.5 hr and 8.5 hr intervals. Individual photoactivated cells are identified by arrows (to show maintenance of photoactivated fluorescence signal) and by arrowheads (to show changes in cell direction). Each photoactivated region of interest is approximately 50 um in height.
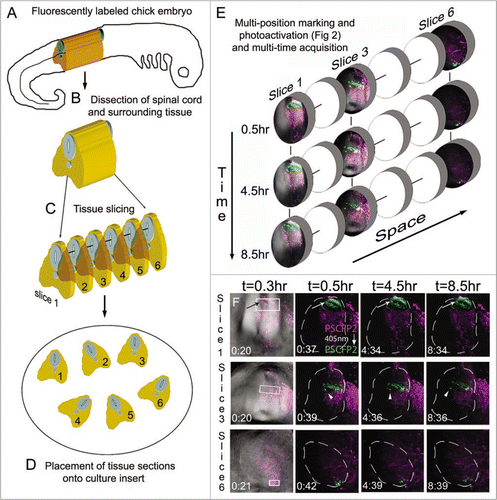
Figure 3 Multi-position photoactivation and multi-time acquisition. (A) A typical fluorescently labeled (PSCFP2) chick embryo at day 4 with (B) the spinal cord removed and (C) cut into slice preparations that (D) are laid onto a culture insert. (E) Within each tissue slice, a region of interest is photoactivated and set up for time-lapse acquisition in a sequential manner, with three typical slice data shown at 0.5 hr, 4.5 hr and 8.5 hr intervals. Individual photoactivated cells are identified by arrows (to show maintenance of photoactivated fluorescence signal) and by arrowheads (to show changes in cell direction). Each photoactivated region of interest is approximately 50 um in height.

Figure 4 Towards cell tracing during organogenesis: determining the fates of early versus late migrating sympathetic precursor cells. (A) Schematic of E3 chick embryo with boxed region indicating region of interest for photoactivation cell labeling of premigratory neural crest cells. (B) Schematic of typical trunk neural crest cell medial to ventral migratory pathway through the presumptive dorsal root ganglia (DRG) to reach the sympathetic ganglia (SG) adjacent to the dorsal aorta (DA). (C) Sagital view of the trunk structures including the rostral (R) and caudal (C) somite and the SG and inter-ganglionic region (IG). (D) Schematic of the SG that form into a neuronal core (N), grey shaded area, and progenitor neural crest cells, yellow area. (E) In ovo image of KikgR unphotoactivated (green) construct expressed by premigratory neural crest cells in the neural tube, and beginning to emerge into the rostral somite. (F) In ovo image of post-photoactivation (red) of neural crest cells within the highlighted box, showing a group of cells that recently emerged from the neural tube beginning their medio-ventral migration path to populate either the dorsal root or sympathetic ganglia. Unphotoactivated cells remained green. (G) Whole embryo explant image of where the photoactivated cells migrated and localized. From the initial group of photoactivated cell, a portion stopped in the dorsal root ganglia and some continued ventral to give rise to the sympathetic ganglia. (H and I) pre- and post-in ovo photoactivation of early neural crest cells emerging from the neural tube (within box). (J) Embryo after 48 hours from (I), transverse sectioned and stained with Ben (blue). (K–N) Higher magnification of boxed region in (J). Line scan intensities for cells in part (H, I and K) are shown at the bottom of the figure. Pre-photoconversion levels show GFP intensity above 250 AFU and RFP channel below 50 AFU. Post-photoconversion shows an increase in RFP intensity above 250 AFU and a decrease in GRF intensity to below 50 AFU. Cells from 1 K include cell 1 = unphotoconverted non-neural cell (green only), cell 2 = unphotoconverted neural cell (Green and Blue), cell 3 = photoactivated neural cells (Red, Blue and Green-this cell has green fluorescence after 72 hours post-photoconversion because the PSCFP will continue to be made in cells that express it whether it is photoconverted or not), cell 4 = unphotoconverted non-neural cell (green only). nt, neural tube; DRG, dorsal root ganglia; SG, sympathetic ganglia; DA, dorsal aorta; no, notochord.
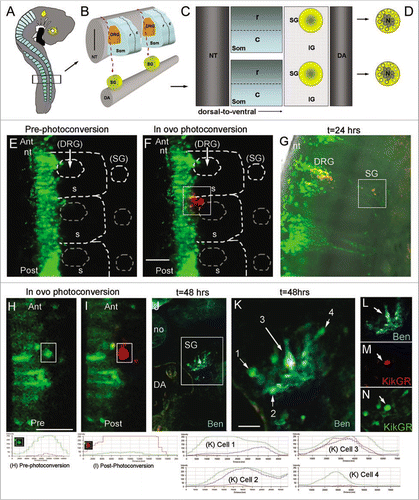
Figure 4 Towards cell tracing during organogenesis: determining the fates of early versus late migrating sympathetic precursor cells. (A) Schematic of E3 chick embryo with boxed region indicating region of interest for photoactivation cell labeling of premigratory neural crest cells. (B) Schematic of typical trunk neural crest cell medial to ventral migratory pathway through the presumptive dorsal root ganglia (DRG) to reach the sympathetic ganglia (SG) adjacent to the dorsal aorta (DA). (C) Sagital view of the trunk structures including the rostral (R) and caudal (C) somite and the SG and inter-ganglionic region (IG). (D) Schematic of the SG that form into a neuronal core (N), grey shaded area, and progenitor neural crest cells, yellow area. (E) In ovo image of KikgR unphotoactivated (green) construct expressed by premigratory neural crest cells in the neural tube, and beginning to emerge into the rostral somite. (F) In ovo image of post-photoactivation (red) of neural crest cells within the highlighted box, showing a group of cells that recently emerged from the neural tube beginning their medio-ventral migration path to populate either the dorsal root or sympathetic ganglia. Unphotoactivated cells remained green. (G) Whole embryo explant image of where the photoactivated cells migrated and localized. From the initial group of photoactivated cell, a portion stopped in the dorsal root ganglia and some continued ventral to give rise to the sympathetic ganglia. (H and I) pre- and post-in ovo photoactivation of early neural crest cells emerging from the neural tube (within box). (J) Embryo after 48 hours from (I), transverse sectioned and stained with Ben (blue). (K–N) Higher magnification of boxed region in (J). Line scan intensities for cells in part (H, I and K) are shown at the bottom of the figure. Pre-photoconversion levels show GFP intensity above 250 AFU and RFP channel below 50 AFU. Post-photoconversion shows an increase in RFP intensity above 250 AFU and a decrease in GRF intensity to below 50 AFU. Cells from 1 K include cell 1 = unphotoconverted non-neural cell (green only), cell 2 = unphotoconverted neural cell (Green and Blue), cell 3 = photoactivated neural cells (Red, Blue and Green-this cell has green fluorescence after 72 hours post-photoconversion because the PSCFP will continue to be made in cells that express it whether it is photoconverted or not), cell 4 = unphotoconverted non-neural cell (green only). nt, neural tube; DRG, dorsal root ganglia; SG, sympathetic ganglia; DA, dorsal aorta; no, notochord.

Reprints and Corporate Permissions

Please note: Selecting permissions does not provide access to the full text of the article, please see our help page How do I view content?

To request a reprint or corporate permissions for this article, please click on the relevant link below:

Academic Permissions

Please note: Selecting permissions does not provide access to the full text of the article, please see our help page How do I view content?

Obtain permissions instantly via Rightslink by clicking on the button below:

If you are unable to obtain permissions via Rightslink, please complete and submit this Permissions form. For more information, please visit our Permissions help page.