Figures & data
Figure 1 Intravenous glucose tolerance in rhesus macaques. Glucose in peripheral venous blood was measured prior to intravenous infusion of 0.5 g/kg over 30 seconds as 50% dextrose (Time 0) and at several times after infusion in three fasted rhesus macaques either prior to administration of 60–140 mg/kg intravenous STZ (Pre-STZ); 5 days following administration of STZ (Post STZ); or 3 months following transplantation of 20–40 E28 pig pancreatic primordia in mesentery of STZ-diabetic macaques (Post-TX). Levels measured at 60 minutes after intravenous glucose administration were not different from levels measured at Time 0 in Pre-STZ or Post-TX groups [Bonferroni Multiple Comparisons Test, p < 0.05, two tailed analysis (GraphPad Instat 3, San Diego CA)]. In contrast, levels measured at 60 minutes after intravenous glucose infusion were elevated relative to those measured at Time 0 in the Post-STZ group. Data are shown as mean ± SE (3 macaques).
![Figure 1 Intravenous glucose tolerance in rhesus macaques. Glucose in peripheral venous blood was measured prior to intravenous infusion of 0.5 g/kg over 30 seconds as 50% dextrose (Time 0) and at several times after infusion in three fasted rhesus macaques either prior to administration of 60–140 mg/kg intravenous STZ (Pre-STZ); 5 days following administration of STZ (Post STZ); or 3 months following transplantation of 20–40 E28 pig pancreatic primordia in mesentery of STZ-diabetic macaques (Post-TX). Levels measured at 60 minutes after intravenous glucose administration were not different from levels measured at Time 0 in Pre-STZ or Post-TX groups [Bonferroni Multiple Comparisons Test, p < 0.05, two tailed analysis (GraphPad Instat 3, San Diego CA)]. In contrast, levels measured at 60 minutes after intravenous glucose infusion were elevated relative to those measured at Time 0 in the Post-STZ group. Data are shown as mean ± SE (3 macaques).](/cms/asset/72ba3ca5-d63e-48d7-a1cc-ed5a588cd248/kogg_a_10913283_f0001.gif)
Figure 2 Photograph of kidney from a STZ-treated rat transplanted previously with embryonic pig pancreas in mesentery. The photo was taken 4 weeks after implantation of pig islets in kidney. The whitish well-demarcated graft (white arrow) and the origin of a venous blood vessel (black arrow) are shown. Reproduced with permission from the American Society for Investigative Pathology.Citation12
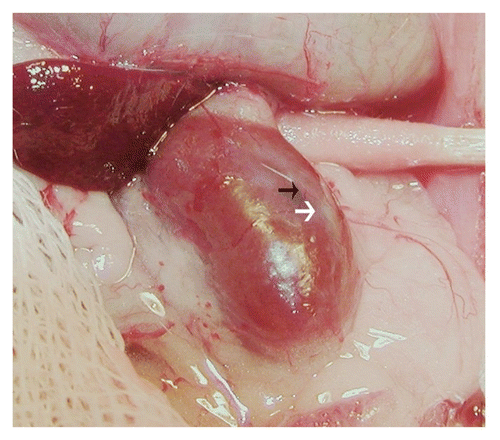
Figure 3 Photomicrographs of kidney from a diabetic rat into which embryonic pig pancreas had been transplanted in mesentery and pig islets had been transplanted subsequently in kidney stained using anti-insulin antibody (A and C) or control antibody (B and D) and sections hybridized to antisense (E) or sense (F) porcine proinsulin mRNA probes. Arrowheads delineate an expanded subcapsular space (A and B). Arrows delineate tissue in the subcapsular space that stains positive for insulin (red-brown) (C) or positive staining for porcine proinsulin mRNA (E). PT, proximal tubule (A and B). Scale bars 80 µm (A and B) and 10 µm (C–F). Reproduced with permission from the American Society for Investigative Pathology.Citation12
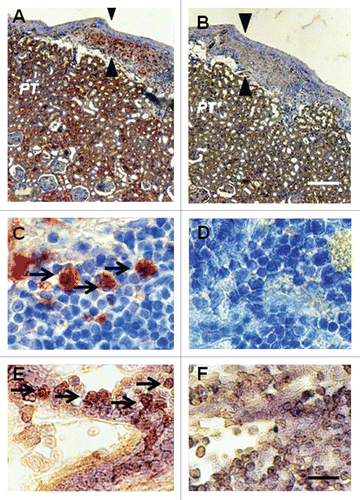
Figure 4 Photomicrographs of the contralateral kidney from a diabetic rat into which embryonic pig pancreas had been transplanted in mesentery and pig islets had been implanted subsequently in the other kidney (A–D) or of a kidney from a diabetic rat in which pig islets had been implanted without prior transplantation of E28 pig pancreatic primordia (E and F) stained using anti-insulin antibody (A, C and E) or control antibody (B, D and F). Arrowheads delineate a normal sized subcapsular space (A and C) or expanded subcapsular space (E). PT, proximal tubule (A, B, E and F). M, medulla (A and B). Scale bars 100 µm (A and B) 10 µm (C and D) or 40 µm (E and F). Reproduced with permission from the American Society for Investigative Pathology.Citation12
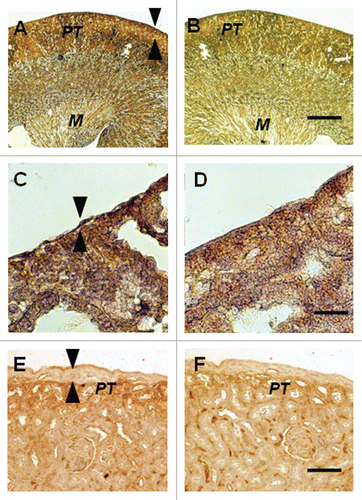
Figure 5 Fluorescence microscopy of tissue sections originating from (A) a normal porcine pancreas or (B–D) a diabetic rat that had been transplanted with embryonic pig pancreas in mesentery and subsequently with porcine islets in kidney: (B) a subcapsular section from kidney, T tubule, RC Renal Capsule; (C) a section of mesenteric lymph node, GC, germinal center, INSET enlargment; and (D) renal cortex, T, tubule. Arrows (A–C) delineate pig X chromosomes. Scale bar 10 um (D). Reproduced with permission from the American Society for Investigative Pathology.Citation12
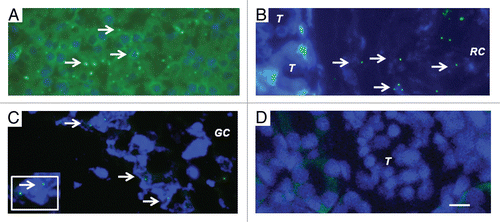
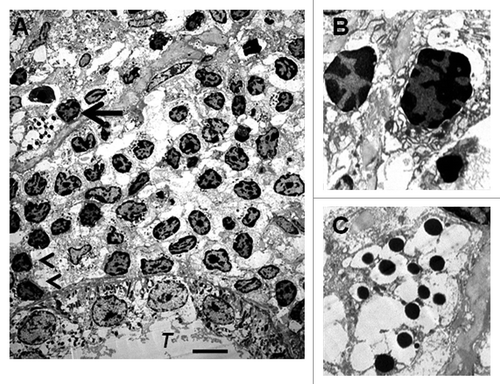
Figure 6 Electron micrographs of rat kidney following sequential transplantation of E28 pig pancreatic primordia in mesentery and implantation of porcine islets in kidney. (A) Subcapsular space. T, renal tubule; Cell containing granules with a crystalline core surrounded by a clear space is delineated by an arrow; Macrophages are delineated by arrowheads. (B) Enlargement of macrophages. (C) Enlargement of granules with a crystalline core surrounded by a clear space. Scale bar 5 um (A). Reproduced with permission from the American Society for Investigative Pathology.Citation12
