724
Views
60
CrossRef citations to date
0
Altmetric
Research Paper

H-Type Bovine Spongiform Encephalopathy

Complex Molecular Features and Similarities with Human Prion Diseases

, , , &
Pages 61-68 | Received 17 Nov 2006, Accepted 12 Jan 2007, Published online: 01 Mar 2007

Figures & data

Figure 1 Molecular discrimination of H-type and typical BSE in cattle and in C57Bl/6 infected mice. Western blot detection of PrPres in cattle (A–C) or C57Bl/6 infected mice (E–G), from H-type isolate (right lane in each panel) or typical BSE (left lane in each panel), using 12B2 (A and E), Sha31 (B and F) or SAF84 (C and G) monoclonal antibodies. In each Western blot, typical BSE is shown in the left lane and H-type BSE in the right lane. Brain equivalent quantities loaded per lane were 100 µg (left lanes) and 250 µg (right lanes) for cattle samples and 1.2 mg (left lanes) and 4.8 mg (right lanes) for mouse samples. Inset of (A) shows the N-terminal PrPres fragment (≈7 kDa) in cattle (left lane) and mouse (right lane). (D) Interpretation of the Western blot profile observed with SAF84 monoclonal antibody. (H) Unspecific immunoreactivity of anti-mouse Ig conjugate on samples prepared from normal brain of C57Bl/6 mouse.
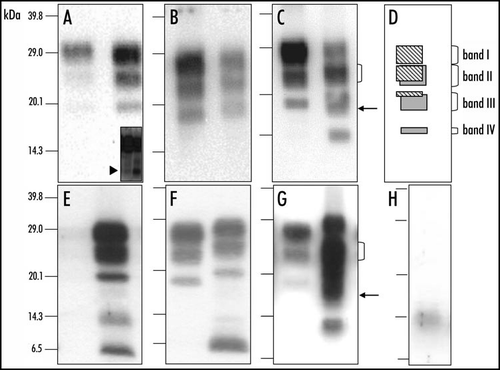
Figure 1 Molecular discrimination of H-type and typical BSE in cattle and in C57Bl/6 infected mice. Western blot detection of PrPres in cattle (A–C) or C57Bl/6 infected mice (E–G), from H-type isolate (right lane in each panel) or typical BSE (left lane in each panel), using 12B2 (A and E), Sha31 (B and F) or SAF84 (C and G) monoclonal antibodies. In each Western blot, typical BSE is shown in the left lane and H-type BSE in the right lane. Brain equivalent quantities loaded per lane were 100 µg (left lanes) and 250 µg (right lanes) for cattle samples and 1.2 mg (left lanes) and 4.8 mg (right lanes) for mouse samples. Inset of (A) shows the N-terminal PrPres fragment (≈7 kDa) in cattle (left lane) and mouse (right lane). (D) Interpretation of the Western blot profile observed with SAF84 monoclonal antibody. (H) Unspecific immunoreactivity of anti-mouse Ig conjugate on samples prepared from normal brain of C57Bl/6 mouse.

Figure 2 Molecular analysis of PrPres after deglycosylation in C57Bl/6 infected mice. Western blot analysis of PrPres from cattle (A–C) or C57Bl/6 mice (D–F) infected with H-type (lanes 3 and 4) or typical BSE (lanes 1 and 2), after deglycosylation by PNGase treatment. Monoclonal antibodies used for PrPres detection were 12B2 (A and D), Sha31 (B and E) or SAF84 (C and F). Brain equivalent quantities loaded per lane were (i) from cattle, for typical BSE, 50 (lane 1) or 2,6 (lane 2) mg, and for H-type BSE, 50 (lane 3) or 6 (lane 4) mg, and (ii) from mice, for typical BSE, 0.5 (D and F) or 0.3 (E) mg, and for H-type BSE, 2.5 (D and F) or 1.3 mg (E).
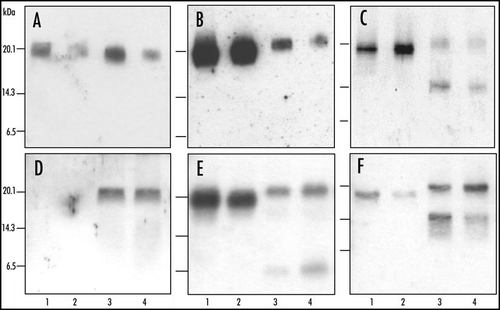
Figure 2 Molecular analysis of PrPres after deglycosylation in C57Bl/6 infected mice. Western blot analysis of PrPres from cattle (A–C) or C57Bl/6 mice (D–F) infected with H-type (lanes 3 and 4) or typical BSE (lanes 1 and 2), after deglycosylation by PNGase treatment. Monoclonal antibodies used for PrPres detection were 12B2 (A and D), Sha31 (B and E) or SAF84 (C and F). Brain equivalent quantities loaded per lane were (i) from cattle, for typical BSE, 50 (lane 1) or 2,6 (lane 2) mg, and for H-type BSE, 50 (lane 3) or 6 (lane 4) mg, and (ii) from mice, for typical BSE, 0.5 (D and F) or 0.3 (E) mg, and for H-type BSE, 2.5 (D and F) or 1.3 mg (E).

Figure 3 Quantitative molecular features of PrPres in C57Bl/6 infected mice. Molecular masses (A) and glycoform ratios (B) (means ± standard deviations) of PrPres detected with Sha31 antibody, from C57Bl/6 mice infected with H-type or typical BSE isolates. PrPres of mice infected with an experimental scrapie (C506M3) strainCitation4 was used as a control.
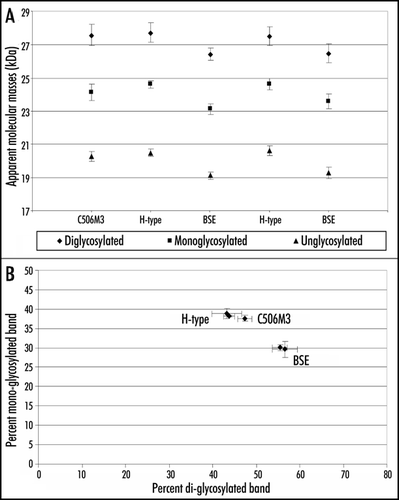
Figure 3 Quantitative molecular features of PrPres in C57Bl/6 infected mice. Molecular masses (A) and glycoform ratios (B) (means ± standard deviations) of PrPres detected with Sha31 antibody, from C57Bl/6 mice infected with H-type or typical BSE isolates. PrPres of mice infected with an experimental scrapie (C506M3) strainCitation4 was used as a control.

Figure 4 Schematic representation of proteinase K-resistant PrP fragments identified from H-type or typical BSE. Putative regions for proteinase K cleavage are indicated, as assessed by immunoreactivities with anti-PrP antibodies, and categories of epitope locations (groups A, B and C).
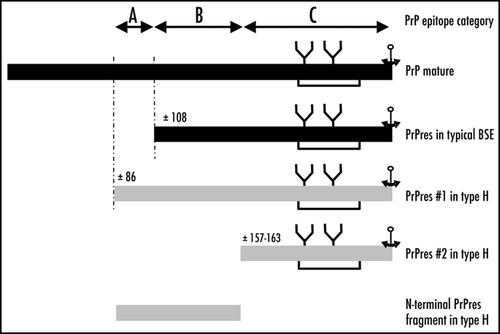
Figure 4 Schematic representation of proteinase K-resistant PrP fragments identified from H-type or typical BSE. Putative regions for proteinase K cleavage are indicated, as assessed by immunoreactivities with anti-PrP antibodies, and categories of epitope locations (groups A, B and C).

Table 1 Antibodies used to characterize H-type and typical BSE

Reprints and Corporate Permissions

Please note: Selecting permissions does not provide access to the full text of the article, please see our help page How do I view content?

To request a reprint or corporate permissions for this article, please click on the relevant link below:

Academic Permissions

Please note: Selecting permissions does not provide access to the full text of the article, please see our help page How do I view content?

Obtain permissions instantly via Rightslink by clicking on the button below:

If you are unable to obtain permissions via Rightslink, please complete and submit this Permissions form. For more information, please visit our Permissions help page.