871
Views
20
CrossRef citations to date
0
Altmetric
Research Paper

Prion infection promotes extensive accumulation of α-synuclein in aged human α-synuclein transgenic mice

, , , , , & show all
Pages 184-190 | Received 21 Feb 2012, Accepted 23 Feb 2012, Published online: 01 Apr 2012

Figures & data

Figure 1. Survival period of prion-infected α-synuclein transgenic and nontransgenic control mice. (A) In mNS-inoculated mice, survival periods were modestly, but significantly accelerated in mice having α-synuclein aggregates. (B) In contrast, RML-infected mice showed similar survival periods in α-synuclein transgenic and non-transgenic mice.
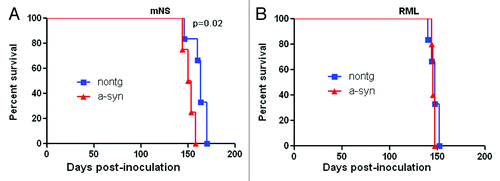
Figure 1. Survival period of prion-infected α-synuclein transgenic and nontransgenic control mice. (A) In mNS-inoculated mice, survival periods were modestly, but significantly accelerated in mice having α-synuclein aggregates. (B) In contrast, RML-infected mice showed similar survival periods in α-synuclein transgenic and non-transgenic mice.

Figure 2. Infectious prions promote increased α-synuclein immunoreactivity. (A) α-synuclein aggregates typically deposit within neurons (labeled “n”), shown here in the frontal cortex and hippocampus, and in the neuropil (granular staining) as seen in the mock control. (B) RML prion infection. (C) mNS prion infection. In prion-infected mice, α-synuclein aggregates were more abundant in neurons and in the neuropil (cortex), and additionally appear as scattered plaque-like structures (labeled pl). Vacuoles due to the prion disease are also evident (labeled v). Scale bar = 20 µm. Computer aided image analysis for the levels of α-synuclein immunoreactivity in the neuropil of the frontal cortex, hippocampus and basal ganglia expressed as corrected optical density. (D) Stereological (dissector method) analysis of the estimated numbers of α-synuclein positive neurons in the frontal cortex, hippocampus and basal ganglia expressed as total counts x 102. *p < 0.05 by one way ANOVA with post hoc Dunnet's when comparing to mock control, n = 5 per group.
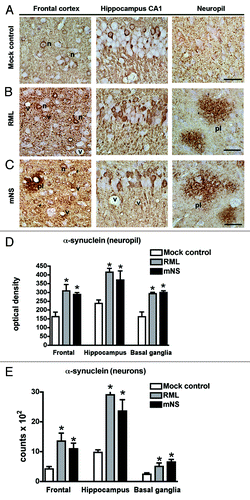
Figure 2. Infectious prions promote increased α-synuclein immunoreactivity. (A) α-synuclein aggregates typically deposit within neurons (labeled “n”), shown here in the frontal cortex and hippocampus, and in the neuropil (granular staining) as seen in the mock control. (B) RML prion infection. (C) mNS prion infection. In prion-infected mice, α-synuclein aggregates were more abundant in neurons and in the neuropil (cortex), and additionally appear as scattered plaque-like structures (labeled pl). Vacuoles due to the prion disease are also evident (labeled v). Scale bar = 20 µm. Computer aided image analysis for the levels of α-synuclein immunoreactivity in the neuropil of the frontal cortex, hippocampus and basal ganglia expressed as corrected optical density. (D) Stereological (dissector method) analysis of the estimated numbers of α-synuclein positive neurons in the frontal cortex, hippocampus and basal ganglia expressed as total counts x 102. *p < 0.05 by one way ANOVA with post hoc Dunnet's when comparing to mock control, n = 5 per group.

Figure 3. RML and mNS prions results in the formation of plaque-like α-synuclein immunoreactivity structures. All panels are from the basal ganglia. (A) Immunohistochemical analysis with an antibody against total α-synuclein. In RML or mNS prion-inoculated tg mice, abundant α-synuclein aggregates were detected around the neuronal cell bodies (N) and the axonal and dendritic processes. The insets display images at higher power of the α-synuclein plaque-like structures. The arrows indicate dystrophic neurites in the midst of the plaque-like lesions.(B) Immunohistochemical analysis with an antibody against p-ser129 α-synuclein. In RML or mNS prion-inoculated tg mice, abundant α-synuclein aggregates were detected in dystrophic neurites. The insets display images at higher power of α-synuclein affected abnormal axons. Scale bar = 50 µm.
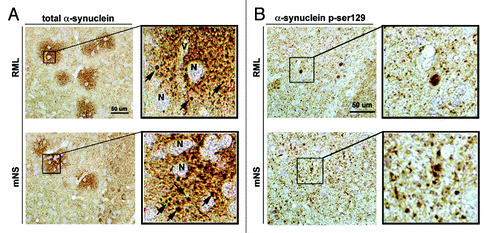
Figure 3. RML and mNS prions results in the formation of plaque-like α-synuclein immunoreactivity structures. All panels are from the basal ganglia. (A) Immunohistochemical analysis with an antibody against total α-synuclein. In RML or mNS prion-inoculated tg mice, abundant α-synuclein aggregates were detected around the neuronal cell bodies (N) and the axonal and dendritic processes. The insets display images at higher power of the α-synuclein plaque-like structures. The arrows indicate dystrophic neurites in the midst of the plaque-like lesions.(B) Immunohistochemical analysis with an antibody against p-ser129 α-synuclein. In RML or mNS prion-inoculated tg mice, abundant α-synuclein aggregates were detected in dystrophic neurites. The insets display images at higher power of α-synuclein affected abnormal axons. Scale bar = 50 µm.

Figure 4. Prion-induced histopathology is unmodified by the co-occurrence of α-synuclein aggregates. Brain sections from transgenic (α-synuclein) and non-transgenic mice inoculated with mNS or RML prions show similar spongiform degeneration (labeled as * on HE), PrPSc aggregate morphology, and astrogliosis. mNS prions induce small (2–4 µm), dense, punctuate aggregates (arrows), whereas RML prions induce diffuse, patchy aggregates (arrowheads). Scale bar = 200 µm.
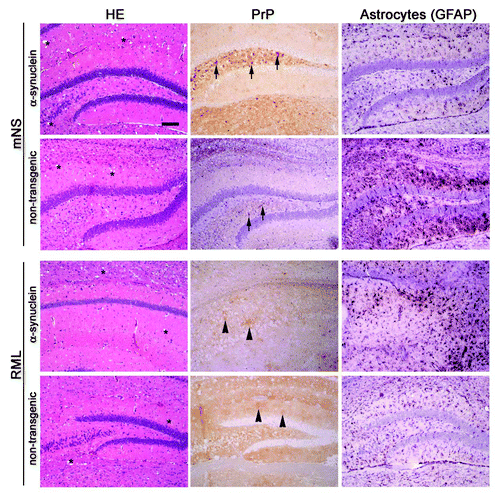
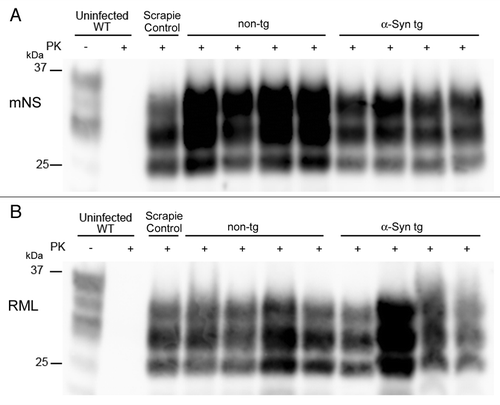
Figure 4. Prion-induced histopathology is unmodified by the co-occurrence of α-synuclein aggregates. Brain sections from transgenic (α-synuclein) and non-transgenic mice inoculated with mNS or RML prions show similar spongiform degeneration (labeled as * on HE), PrPSc aggregate morphology, and astrogliosis. mNS prions induce small (2–4 µm), dense, punctuate aggregates (arrows), whereas RML prions induce diffuse, patchy aggregates (arrowheads). Scale bar = 200 µm.

Figure 5. Western blot profiles of PrPSc. A PrP immunoblot for PK-resistant PrPSc reveals similar electrophoretic mobility and glycoform patterns in α-synuclein transgenic and non-transgenic mice inoculated with (A) mNS or (B) RML prions.

Figure 5. Western blot profiles of PrPSc. A PrP immunoblot for PK-resistant PrPSc reveals similar electrophoretic mobility and glycoform patterns in α-synuclein transgenic and non-transgenic mice inoculated with (A) mNS or (B) RML prions.

Reprints and Corporate Permissions

Please note: Selecting permissions does not provide access to the full text of the article, please see our help page How do I view content?

To request a reprint or corporate permissions for this article, please click on the relevant link below:

Academic Permissions

Please note: Selecting permissions does not provide access to the full text of the article, please see our help page How do I view content?

Obtain permissions instantly via Rightslink by clicking on the button below:

If you are unable to obtain permissions via Rightslink, please complete and submit this Permissions form. For more information, please visit our Permissions help page.