401
Views
4
CrossRef citations to date
0
Altmetric
Commentary & View

Prion infection

Seeded fibrillization or more?

&
Pages 67-72 | Received 28 Jul 2008, Accepted 23 Sep 2008, Published online: 01 Oct 2008

Figures & data

Figure 1 Structures involved in the in vitro conversion of rec PrP(90–231) induced by lowering SDS concentration. The structures analysed within the in vitro conversion system are summarized. Exemplarily for the methods used to analyse these structures, beneath the different intermediates the CD-spectra are shown. Next to the aggregated states the electron micrograph of these structures are shown. The upper part represents the conversion without added NaCl, the lower part with added NaCl, respectively. Modified according to reference Citation18.
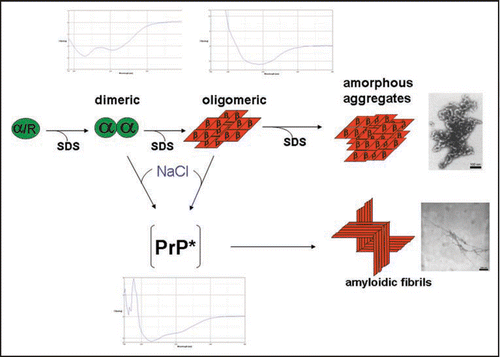
Figure 1 Structures involved in the in vitro conversion of rec PrP(90–231) induced by lowering SDS concentration. The structures analysed within the in vitro conversion system are summarized. Exemplarily for the methods used to analyse these structures, beneath the different intermediates the CD-spectra are shown. Next to the aggregated states the electron micrograph of these structures are shown. The upper part represents the conversion without added NaCl, the lower part with added NaCl, respectively. Modified according to reference Citation18.

Figure 2 Model of the prion protein dimer. Stereo presentation of the model for the PrP dimer. The structure of segment 92–124 (blue) is the result of Kaimann et al.,Citation22 the structure of segment 125–228 (cyan) is taken from the NMR analysis.Citation23 Red arrows represent the glycolipid anchor; thick blue arrows, glycosyl groups; and thin blue arrows, N-termini. Figure according to reference Citation22.
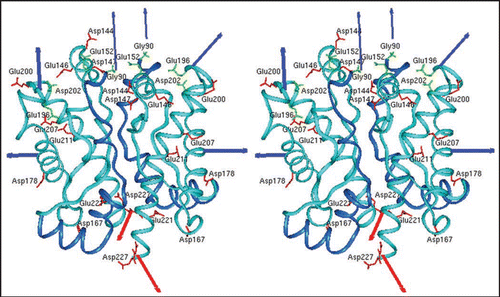
Figure 2 Model of the prion protein dimer. Stereo presentation of the model for the PrP dimer. The structure of segment 92–124 (blue) is the result of Kaimann et al.,Citation22 the structure of segment 125–228 (cyan) is taken from the NMR analysis.Citation23 Red arrows represent the glycolipid anchor; thick blue arrows, glycosyl groups; and thin blue arrows, N-termini. Figure according to reference Citation22.

Figure 3 Fibrils formed of different PrP preparations by the in vitro conversion system in presence of NaCl. Electron micrographs of fibrils formed of different PrP preparations are shown. Recombinant (recPrP) as well as fully translational modified PrP (reconstituted SHaPrP 27–30, natural full length PrPC) with hamster (SHa) sequenz as well as full length recombinant bovine PrP (bovine rec PrP 25–241) were used. Figure rearranged according to reference Citation24 and Citation26.
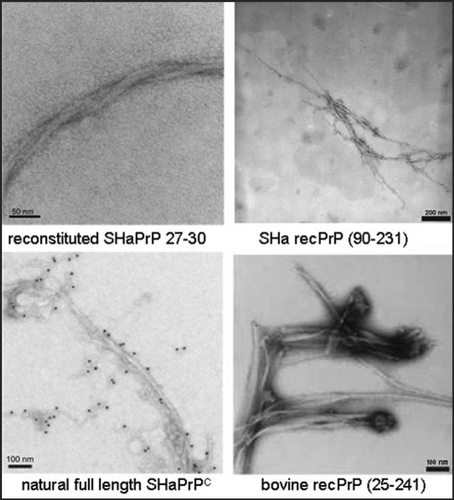
Figure 3 Fibrils formed of different PrP preparations by the in vitro conversion system in presence of NaCl. Electron micrographs of fibrils formed of different PrP preparations are shown. Recombinant (recPrP) as well as fully translational modified PrP (reconstituted SHaPrP 27–30, natural full length PrPC) with hamster (SHa) sequenz as well as full length recombinant bovine PrP (bovine rec PrP 25–241) were used. Figure rearranged according to reference Citation24 and Citation26.

Figure 4 Mechanistic model of PrP fibrillization. A proposed mechanistic model depicts the preamyloid state in a monomer-dimer equilibrium, stationary state of trimer, stable nucleus of two trimers, and a growing fibril. Figure according to reference Citation25.

Figure 4 Mechanistic model of PrP fibrillization. A proposed mechanistic model depicts the preamyloid state in a monomer-dimer equilibrium, stationary state of trimer, stable nucleus of two trimers, and a growing fibril. Figure according to reference Citation25.

Figure 5 Seeded fibril formation. RecPrP (80 ng/µl) seeded with purified PrPSc (diamonds) forms amyloid fibrils readily compared with controls: recPrP + uninfected 1.6 × 10⁻⁴ brain equivalents per µl (x); recPrP alone (triangles); purified PrPSc alone (dashes). Fibril formation was monitored by using the ThT fluorescence assay. Electron micrographs: PrPSc aggregates after NaPTA precipitation, recPrP + PrPSc after seeding assay. Figure rearranged according to reference Citation25.
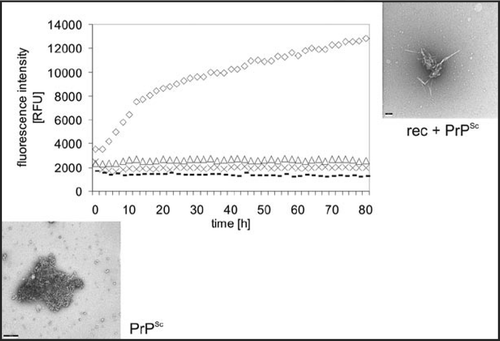
Figure 5 Seeded fibril formation. RecPrP (80 ng/µl) seeded with purified PrPSc (diamonds) forms amyloid fibrils readily compared with controls: recPrP + uninfected 1.6 × 10⁻⁴ brain equivalents per µl (x); recPrP alone (triangles); purified PrPSc alone (dashes). Fibril formation was monitored by using the ThT fluorescence assay. Electron micrographs: PrPSc aggregates after NaPTA precipitation, recPrP + PrPSc after seeding assay. Figure rearranged according to reference Citation25.

Figure 6 Reaction scheme of seeded fibrillization. For parameter, see text. Figure according to reference. Citation25.
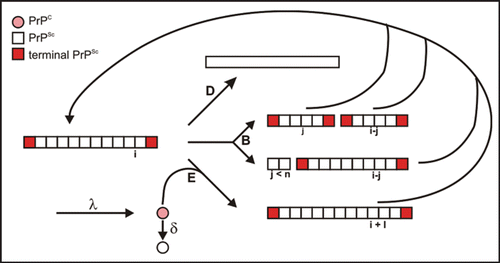
Figure 6 Reaction scheme of seeded fibrillization. For parameter, see text. Figure according to reference. Citation25.

Figure 7 Model of the structural transition of PrPC on the membrane above a certain threshold of PrPC concentration.
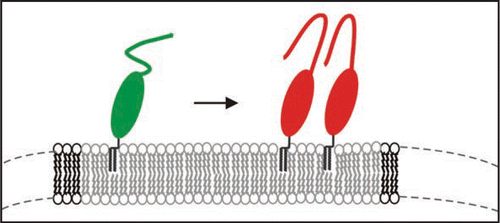
Figure 7 Model of the structural transition of PrPC on the membrane above a certain threshold of PrPC concentration.