1,253
Views
49
CrossRef citations to date
0
Altmetric
Mini Review

Astrocyte signaling and neurodegeneration

New insights into CNS disorders

, &
Pages 28-36 | Received 09 Jul 2012, Accepted 10 Oct 2012, Published online: 23 Oct 2012

Figures & data

Figure 1. Impaired TNFα-dependent glutamate release from hippocampal astrocytes of scrapie-infected mice. Histograms indicate the glutamate release induced by TNFα (30ng/ml) in acute hippocampal slices from C57Bl/6J mice intracerebrally (30 μl, (A) or intraperitoneally (100 μl, (B) inoculated with 1% homogenate from saline-treated (CTRL) or RML-infected, terminally ill CD1 mouse brains. Brains were taken at 14, 90 and 135 d post intracerebral inoculation (d.p.i.) and at 14 and 180 d post intraperitoneal inoculation (Days to terminal disease: i.c.: 164 ± 3; i.p.: 209 ± 5). Acute hippocampal slices were prepared and the amount of glutamate released upon stimulation with TNFα was measured using a previously described enzymatic assay.Citation97 Data are expressed as mean ± s.e.m. (n = 3–6 animals for each experimental group). *p < 0.05 vs. CTRL, two-way ANOVA followed by Scheffe’s F-test.
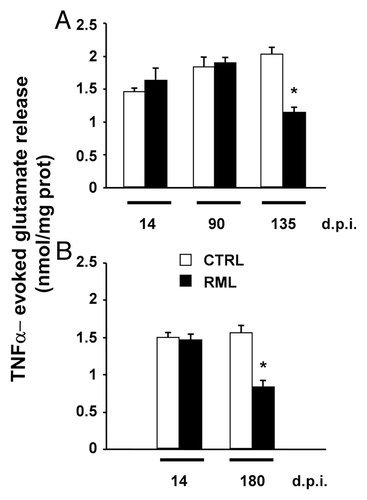
Figure 1. Impaired TNFα-dependent glutamate release from hippocampal astrocytes of scrapie-infected mice. Histograms indicate the glutamate release induced by TNFα (30ng/ml) in acute hippocampal slices from C57Bl/6J mice intracerebrally (30 μl, (A) or intraperitoneally (100 μl, (B) inoculated with 1% homogenate from saline-treated (CTRL) or RML-infected, terminally ill CD1 mouse brains. Brains were taken at 14, 90 and 135 d post intracerebral inoculation (d.p.i.) and at 14 and 180 d post intraperitoneal inoculation (Days to terminal disease: i.c.: 164 ± 3; i.p.: 209 ± 5). Acute hippocampal slices were prepared and the amount of glutamate released upon stimulation with TNFα was measured using a previously described enzymatic assay.Citation97 Data are expressed as mean ± s.e.m. (n = 3–6 animals for each experimental group). *p < 0.05 vs. CTRL, two-way ANOVA followed by Scheffe’s F-test.

Figure 2. Progressive astrocytosis and spongiosis in the hippocampus of scrapie-infected mice. Coronal sections from saline-treated (CTRL) and RML-infected animals (i.c.) at 90 and 135 d.p.i were stained with hematoxylin alone or hematoxylin with the astrocytic marker Glial Fibrillary Acidic Protein (GFAP). Stainings highlight spongiosis and pronounced astrocytosis in the hippocampus of RML-infected mice at 135 d.p.i. Images are representative of 3 animals. Scale bar, 50μm.
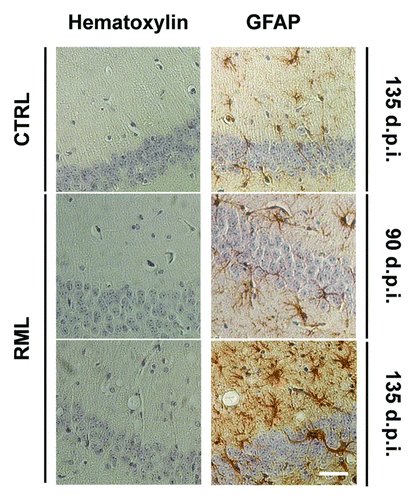
Figure 2. Progressive astrocytosis and spongiosis in the hippocampus of scrapie-infected mice. Coronal sections from saline-treated (CTRL) and RML-infected animals (i.c.) at 90 and 135 d.p.i were stained with hematoxylin alone or hematoxylin with the astrocytic marker Glial Fibrillary Acidic Protein (GFAP). Stainings highlight spongiosis and pronounced astrocytosis in the hippocampus of RML-infected mice at 135 d.p.i. Images are representative of 3 animals. Scale bar, 50μm.

Figure 3. PrPSc accumulation and prion titers in the hippocampus of RML-infected mice. (A) Hippocampal homogenates from saline-treated (CTRL) or RML-infected mice (i.c.) at 14, 90 and 135 d.p.i. were treated in the presence (+) or in the absence (-) of proteinase K to distinguish native PrPC from the proteinase K-resistant PrPSc and analyzed by western blotting (n = 3). (B) Prion titers in the hippocampus of infected animals at 14, 90 and 135 d.p.i. were determined by inoculating homogenates i.c. into CD-1 indicator mice. Data highlight a progressive increase in the amount of PrPSc and infectivity in the hippocampi of RML-infected mice at 135 d.p.i. n/nt = Number of mice with scrapie/ total number of mice inoculated.
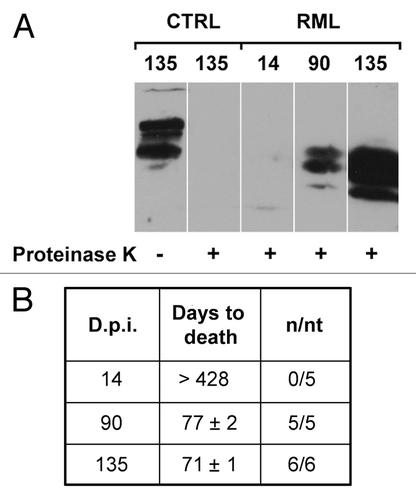
Figure 3. PrPSc accumulation and prion titers in the hippocampus of RML-infected mice. (A) Hippocampal homogenates from saline-treated (CTRL) or RML-infected mice (i.c.) at 14, 90 and 135 d.p.i. were treated in the presence (+) or in the absence (-) of proteinase K to distinguish native PrPC from the proteinase K-resistant PrPSc and analyzed by western blotting (n = 3). (B) Prion titers in the hippocampus of infected animals at 14, 90 and 135 d.p.i. were determined by inoculating homogenates i.c. into CD-1 indicator mice. Data highlight a progressive increase in the amount of PrPSc and infectivity in the hippocampi of RML-infected mice at 135 d.p.i. n/nt = Number of mice with scrapie/ total number of mice inoculated.

Reprints and Corporate Permissions

Please note: Selecting permissions does not provide access to the full text of the article, please see our help page How do I view content?

To request a reprint or corporate permissions for this article, please click on the relevant link below:

Academic Permissions

Please note: Selecting permissions does not provide access to the full text of the article, please see our help page How do I view content?

Obtain permissions instantly via Rightslink by clicking on the button below:

If you are unable to obtain permissions via Rightslink, please complete and submit this Permissions form. For more information, please visit our Permissions help page.