Figures & data
Figure 1. Western blot analysis for protein 14-3-3 in the patient’s CSF is shown in Lane 1. Lane 2 is the positive control.
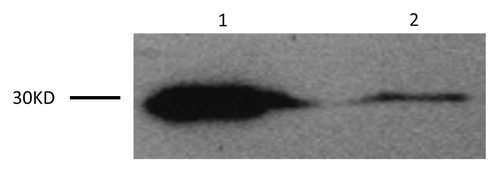
Figure 2. Graphical representation of the PRNP sequence analysis showing a G to A heterozygous transition at codon 203 in one PRNP allele, leading to substitution of valine (V) by isoleucine (I). The arrow above the curve indicates the position where both V and I are present.
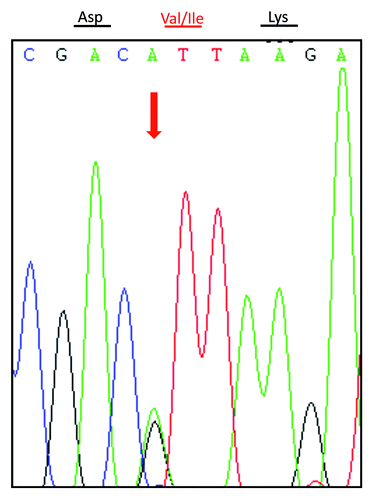
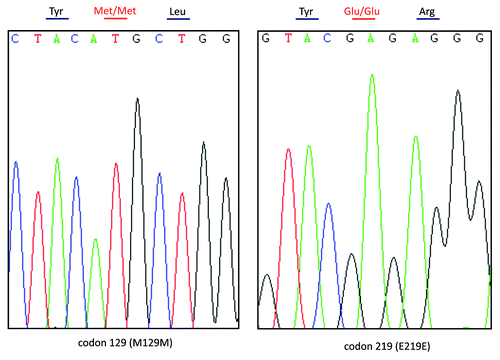
Figure 3. Graphical representation of the Met/Met homozygous polymorphism at codon 129 (A) and Glu/Glu homozygosity at codon 219 (B) of PRNP in this patient.