Figures & data
Table 1. Age of onset and disease duration in the Swedish family affected by IPD with 8-OPRI
Figure 1. Age of onset with mean and SD in the four 8-OPRI families. *P = 0.026 only when compared with the A and Che families.
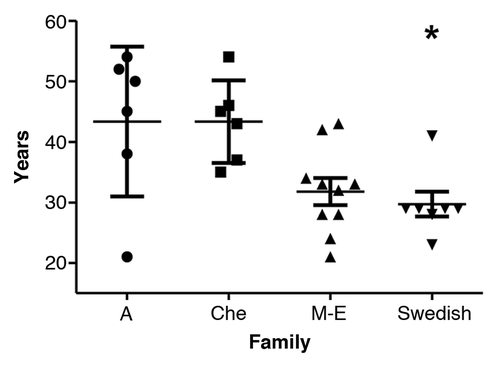
Table 2. Comparison of four 8 OPRI families
Figure 2. (A) Kaplan-Meier survival curve for the 4 8-OPRI families. The Swedish family had the longest survival (log-rank test with P value = 0.004). (B) Kaplan-Meier survival curve when early age of onset is set as less than 30 y (log-rank test with P value < 0.001).
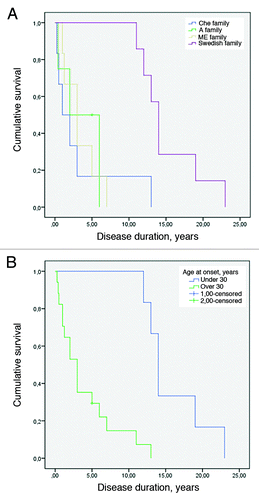
Figure 3. Pearson correlation for early age of onset and long survival (n = 23) with r = -0.642 and P value < 0.001.
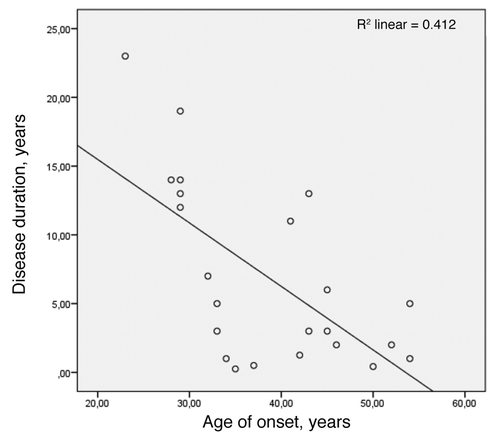
Figure 4. Disease duration with mean and SD in the four 8-OPRI families. ** P = 0.004 when compared with all the three families.
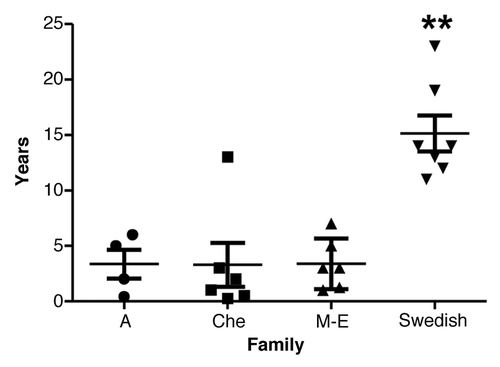
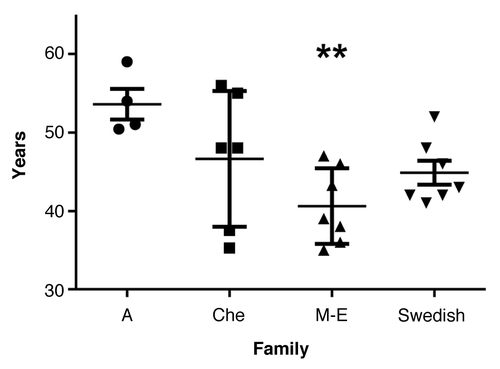
Figure 5. Age of death with mean and SD in the four 8-OPRI families. ** P = 0.009 only when compared with the A family.