652
Views
16
CrossRef citations to date
0
Altmetric
Research Paper

Comparison of 2 synthetically generated recombinant prions

, , , , , , & show all
Pages 215-220 | Received 29 Nov 2013, Accepted 26 Mar 2014, Published online: 10 Apr 2014

Figures & data

Figure 1. Pathological comparison of rPrP-res17kDa- and rPrP-resOSU-inoculated mice. (A) Lesion profile of spongiosis and representative images of HE staining of mice inoculated with rPrP-res17kDa (17kDa) or rPrP-resOSU (OSU) as indicated. P, pons; MB, middle brain; CWM, cerebellum white matter; Hyp, hypothalamus; Tha, thalamus; Hip, hippocampus; CN, caudate nucleus; FC, frontal cortex. The lesion profile was based on the scores of 6 rPrP-res17kDa-inoculated and 15 rPrP-resOSU-inoculated mice. Units of Y-axis are arbitrary units of lesion severity, which are described in detail in methods section. Representative images of spongiosis in frontal cortex (FC), caudate nucleus (CN), and cerebellum white matter (CWM) are shown in (A). (B) PET blot analysis of mice inoculated with rPrP-res17kDa (17kDa) or rPrP-resOSU (OSU) as indicated. PET blots were stained at the same time and using exactly the same condition. Three pairs of mice inoculated with rPrP-res17kDa or rPrP-resOSU were subjected to PET blot analysis and PK-resistant PrP deposition pattern was consistent within the same group. (C) Immunohistochemical staining of aberrant PrP deposit in various regions of mouse brain receiving intracerebral inoculation of rPrP-res17kDa (17kDa) or rPrP-resOSU (OSU) as indicated. Mice receiving control inoculum (PBS + BSA) were used as controls in all panels (Control). These sections were stained at the same time and using exactly the same condition. Three pairs of mice inoculated with rPrP-res17kDa or rPrP-resOSU were analyzed and the aberrant PrP deposition pattern was consistent within the same group.
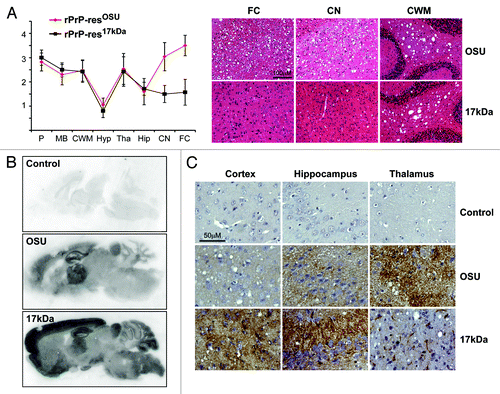
Figure 1. Pathological comparison of rPrP-res17kDa- and rPrP-resOSU-inoculated mice. (A) Lesion profile of spongiosis and representative images of HE staining of mice inoculated with rPrP-res17kDa (17kDa) or rPrP-resOSU (OSU) as indicated. P, pons; MB, middle brain; CWM, cerebellum white matter; Hyp, hypothalamus; Tha, thalamus; Hip, hippocampus; CN, caudate nucleus; FC, frontal cortex. The lesion profile was based on the scores of 6 rPrP-res17kDa-inoculated and 15 rPrP-resOSU-inoculated mice. Units of Y-axis are arbitrary units of lesion severity, which are described in detail in methods section. Representative images of spongiosis in frontal cortex (FC), caudate nucleus (CN), and cerebellum white matter (CWM) are shown in (A). (B) PET blot analysis of mice inoculated with rPrP-res17kDa (17kDa) or rPrP-resOSU (OSU) as indicated. PET blots were stained at the same time and using exactly the same condition. Three pairs of mice inoculated with rPrP-res17kDa or rPrP-resOSU were subjected to PET blot analysis and PK-resistant PrP deposition pattern was consistent within the same group. (C) Immunohistochemical staining of aberrant PrP deposit in various regions of mouse brain receiving intracerebral inoculation of rPrP-res17kDa (17kDa) or rPrP-resOSU (OSU) as indicated. Mice receiving control inoculum (PBS + BSA) were used as controls in all panels (Control). These sections were stained at the same time and using exactly the same condition. Three pairs of mice inoculated with rPrP-res17kDa or rPrP-resOSU were analyzed and the aberrant PrP deposition pattern was consistent within the same group.

Figure 2. Biochemical comparison of rPrP-res17kDa and rPrP-resOSU. (A) The rPrP-res17kDa (17K) and rPrP-resOSU (O) with or without PK digestion were subjected to immunoblot analysis with POM1 and SAF32 antibodies as indicated. (B) Images obtained by scanning the blots in (A) with a Storm 860 PhosphorImager. Arrow indicates the PK resistant band with smallest molecular weight. Asterisks (* and **) indicate the 2 slower migrating PK-resistant bands. (C) The rPrP-res17kDa and rPrP-resOSU were digested with 10, 25, 50, 100, 500, and 1000 μg/mL PK at 37 °C for 30 min. The PK-resistant rPrP-res was detected by immunoblot analysis with POM1 antibody. The curve represents the average of 4 independent experiments and the error bar represents standard deviation. All immunoblot analyses showed similar patterns and a representative image was presented here. C, undigested control samples. (D) The rPrP-res17kDa and rPrP-resOSU were treated with 0, 0.5, 1, 1.5, 2, 2.5, 3, 3.5, and 4 M GuHCl for 1 h, and then digested with 10 μg/mL PK at 37 °C for 30 min. The rPrP-res was detected by immunoblot analysis with POM1 antibody. The curve represents the average of 3 independent experiments and the error bar represents standard deviation. Arrow indicates the position of the smaller rPrP band, which was consistently detected in all 3 experiments.
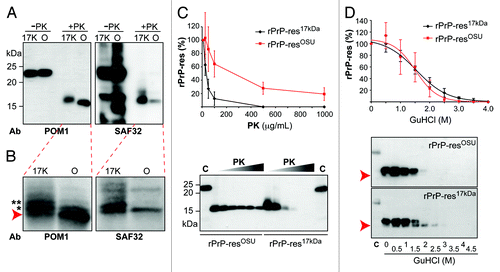
Figure 2. Biochemical comparison of rPrP-res17kDa and rPrP-resOSU. (A) The rPrP-res17kDa (17K) and rPrP-resOSU (O) with or without PK digestion were subjected to immunoblot analysis with POM1 and SAF32 antibodies as indicated. (B) Images obtained by scanning the blots in (A) with a Storm 860 PhosphorImager. Arrow indicates the PK resistant band with smallest molecular weight. Asterisks (* and **) indicate the 2 slower migrating PK-resistant bands. (C) The rPrP-res17kDa and rPrP-resOSU were digested with 10, 25, 50, 100, 500, and 1000 μg/mL PK at 37 °C for 30 min. The PK-resistant rPrP-res was detected by immunoblot analysis with POM1 antibody. The curve represents the average of 4 independent experiments and the error bar represents standard deviation. All immunoblot analyses showed similar patterns and a representative image was presented here. C, undigested control samples. (D) The rPrP-res17kDa and rPrP-resOSU were treated with 0, 0.5, 1, 1.5, 2, 2.5, 3, 3.5, and 4 M GuHCl for 1 h, and then digested with 10 μg/mL PK at 37 °C for 30 min. The rPrP-res was detected by immunoblot analysis with POM1 antibody. The curve represents the average of 3 independent experiments and the error bar represents standard deviation. Arrow indicates the position of the smaller rPrP band, which was consistently detected in all 3 experiments.