505
Views
17
CrossRef citations to date
0
Altmetric
Research Paper

Comparative analysis of essential collective dynamics and NMR-derived flexibility profiles in evolutionarily diverse prion proteins

, , &
Pages 188-200 | Received 17 Apr 2011, Accepted 14 Jun 2011, Published online: 01 Jul 2011

Figures & data

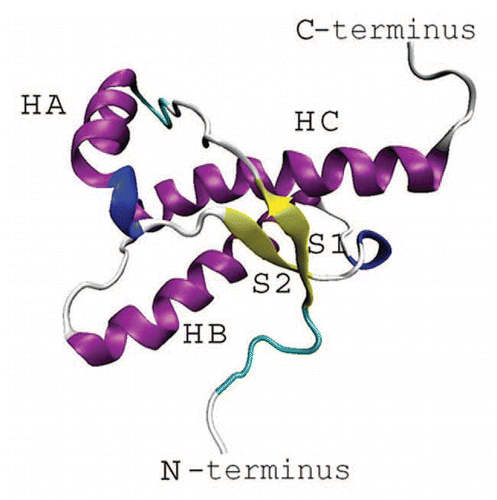
Figure 1 Secondary structure of the globular fold of a prion protein.

Figure 1 Secondary structure of the globular fold of a prion protein.

Figure 2 RCI profiles for globular folds of elk (a), bovine (b), cat (c), hamster (d), human (e), frog (f), turtle (g) and chicken (h) prion proteins.
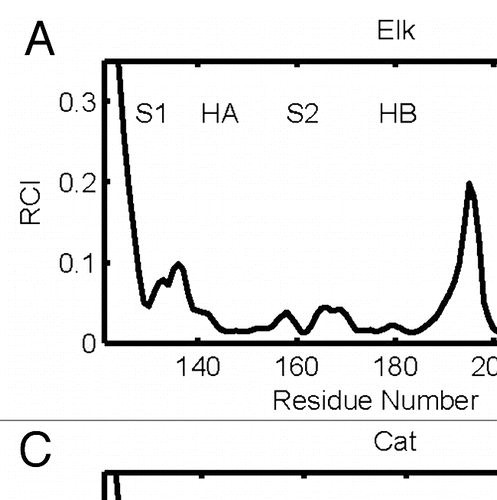
Figure 2 RCI profiles for globular folds of elk (a), bovine (b), cat (c), hamster (d), human (e), frog (f), turtle (g) and chicken (h) prion proteins.

Figure 3 (A) dynamical domains for elk prion protein (ePrP) identified from a MD trajectory at times indicated by the subscripts. Six largest domains are shown with the largest domain colored blue and the smaller domains colored red, green, yellow, cyan and magenta in the order of the decreasing size. (B) flexibility profiles identified at times indicated in the legend box, over-imposed on the experimental RCI profile from 2(a) shown by black dashed curve. Further examples for elk prion protein can be found in Supporting Information, Figures S1 and S2.
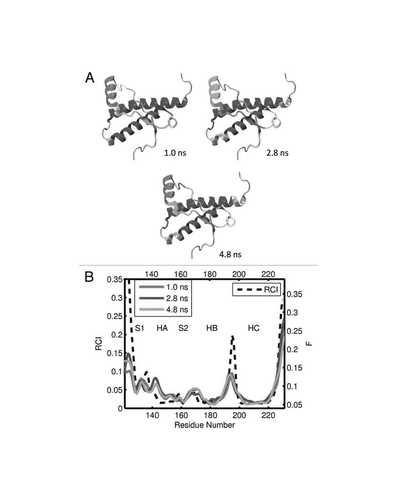
Figure 3 (A) dynamical domains for elk prion protein (ePrP) identified from a MD trajectory at times indicated by the subscripts. Six largest domains are shown with the largest domain colored blue and the smaller domains colored red, green, yellow, cyan and magenta in the order of the decreasing size. (B) flexibility profiles identified at times indicated in the legend box, over-imposed on the experimental RCI profile from 2(a) shown by black dashed curve. Further examples for elk prion protein can be found in Supporting Information, Figures S1 and S2.

Figure 4 (A) Dynamical domains for bovine prion protein (bPrP) identified from a MD trajectory at times indicated by the subscripts. The meaning of colors is as in . (B) flexibility profiles identified at times indicated in the legend box, over-imposed on the experimental RCI profile from 2(b), which is shown by the dashed curve. More examples for dynamical domains and flexibility profiles in bovine prion protein are given in Figures S3 and S4, respectively.
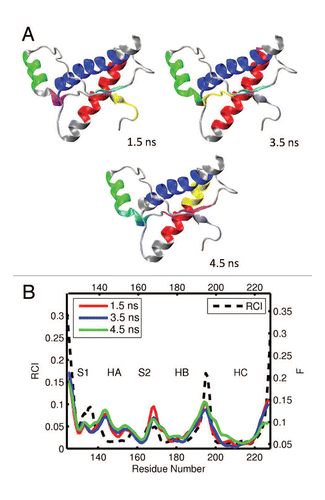
Figure 4 (A) Dynamical domains for bovine prion protein (bPrP) identified from a MD trajectory at times indicated by the subscripts. The meaning of colors is as in Figure 3. (B) flexibility profiles identified at times indicated in the legend box, over-imposed on the experimental RCI profile from 2(b), which is shown by the dashed curve. More examples for dynamical domains and flexibility profiles in bovine prion protein are given in Figures S3 and S4, respectively.

Figure 5 (A) Dynamical domains for cat prion protein (cPrP) identified from a MD trajectory at times indicated by the subscripts. The meaning of colors is as in . (B) flexibility profiles at times indicated in the legend box. The dashed curve shows the experimental RCI profile from 2(c). Further results for dynamical domains and flexibility profiles in cat prion protein are given in Figures S5 and S6, respectively.
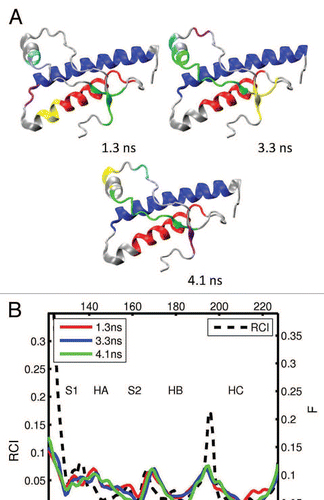
Figure 5 (A) Dynamical domains for cat prion protein (cPrP) identified from a MD trajectory at times indicated by the subscripts. The meaning of colors is as in Figure 3. (B) flexibility profiles at times indicated in the legend box. The dashed curve shows the experimental RCI profile from 2(c). Further results for dynamical domains and flexibility profiles in cat prion protein are given in Figures S5 and S6, respectively.

Figure 6 (A) Dynamical domains for hamster prion protein (shPrP) identified from a MD trajectory at times indicated by the subscripts. The meaning of colors is as in . (B) Flexibility profiles at times indicated in the legend box. The dashed curve shows the experimental RCI profile from 2(d). Other examples for dynamical domains and flexibility profiles in hamster prion protein are given in Figures S7 and S8, respectively.
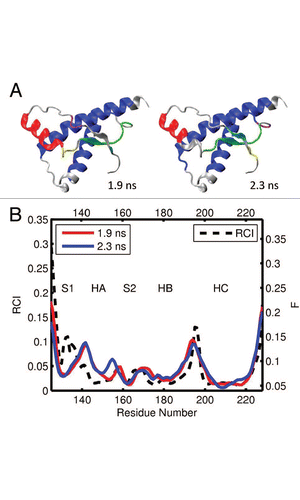
Figure 6 (A) Dynamical domains for hamster prion protein (shPrP) identified from a MD trajectory at times indicated by the subscripts. The meaning of colors is as in Figure 3. (B) Flexibility profiles at times indicated in the legend box. The dashed curve shows the experimental RCI profile from 2(d). Other examples for dynamical domains and flexibility profiles in hamster prion protein are given in Figures S7 and S8, respectively.

Figure 7 (A) Dynamical domains for human prion protein (hPrP) identified from a MD trajectory at times indicated by the subscripts. The meaning of colors is as in . (B) Flexibility profiles at times indicated in the legend box. The dashed curve shows the experimental RCI profile from 2(e). More results for dynamical domains and flexibility profiles in human prion protein can be found in Figures S9 and S10, respectively.
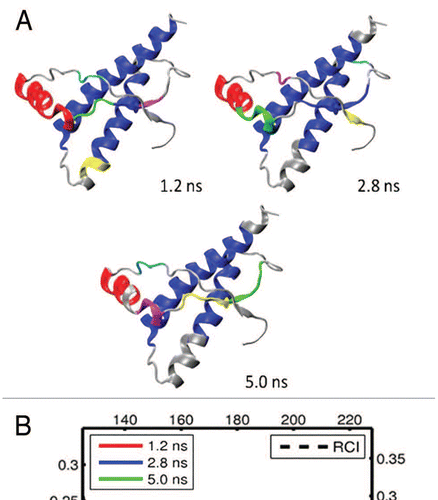
Figure 7 (A) Dynamical domains for human prion protein (hPrP) identified from a MD trajectory at times indicated by the subscripts. The meaning of colors is as in Figure 3. (B) Flexibility profiles at times indicated in the legend box. The dashed curve shows the experimental RCI profile from 2(e). More results for dynamical domains and flexibility profiles in human prion protein can be found in Figures S9 and S10, respectively.

Figure 8 (A) Dynamical domains for frog prion protein (xlPrP) identified from a MD trajectory at times indicated by the subscripts. The meaning of colors is as in . (B) Flexibility profiles at times indicated in the legend box. The dashed curve shows the experimental RCI profile from 2(f). See Figures S11 and S12 for further results on frog prion protein.
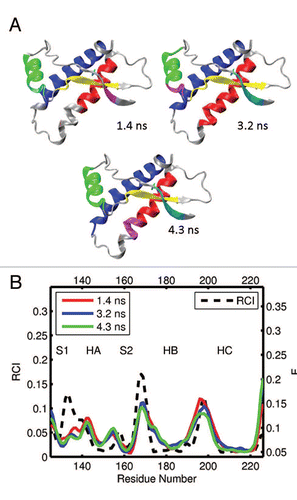
Figure 8 (A) Dynamical domains for frog prion protein (xlPrP) identified from a MD trajectory at times indicated by the subscripts. The meaning of colors is as in Figure 3. (B) Flexibility profiles at times indicated in the legend box. The dashed curve shows the experimental RCI profile from 2(f). See Figures S11 and S12 for further results on frog prion protein.

Figure 9 (A) Dynamical domains for turtle prion protein (tPrP) identified from a MD trajectory at times indicated by the subscripts. The meaning of colors is as in . (B) Flexibility profiles at times indicated in the legend box. The dashed curve shows the experimental RCI profile from 2(g). More examples for dynamical domains and flexibility profiles in turtle prion protein are given in Figures S13 and S14, respectively.
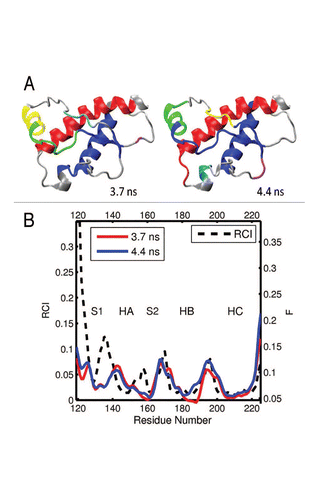
Figure 9 (A) Dynamical domains for turtle prion protein (tPrP) identified from a MD trajectory at times indicated by the subscripts. The meaning of colors is as in Figure 3. (B) Flexibility profiles at times indicated in the legend box. The dashed curve shows the experimental RCI profile from 2(g). More examples for dynamical domains and flexibility profiles in turtle prion protein are given in Figures S13 and S14, respectively.

Figure 10 (A) Dynamical domains for chicken prion protein (cPrP) identified from a MD trajectory at times indicated by the subscripts. The meaning of colors is as in . (B) Flexibility profiles at times indicated in the legend box. The dashed curve shows the experimental RCI profile from 2(h). Further examples for chicken prion protein can be found in Figures S15 and S16.
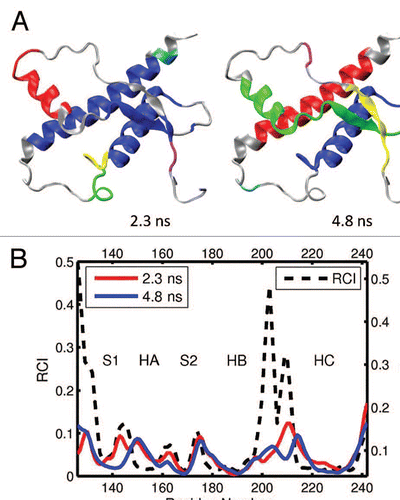
Figure 10 (A) Dynamical domains for chicken prion protein (cPrP) identified from a MD trajectory at times indicated by the subscripts. The meaning of colors is as in Figure 3. (B) Flexibility profiles at times indicated in the legend box. The dashed curve shows the experimental RCI profile from 2(h). Further examples for chicken prion protein can be found in Figures S15 and S16.

Figure 11 Summary of the flexibilities at the loop S2-HB in various species. Shown are the maximum flexibilities in the region of the loop, as derived from the RCI profiles and the computed flexibility profiles. The points indicate the data from different segments, and the dashed line represents a root mean square fit. Note that for RCI, a logarithmic scale is employed.
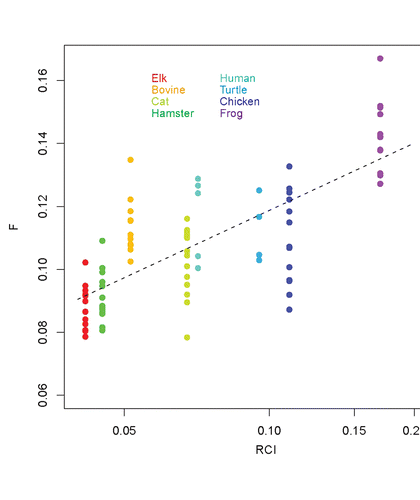
Figure 11 Summary of the flexibilities at the loop S2-HB in various species. Shown are the maximum flexibilities in the region of the loop, as derived from the RCI profiles and the computed flexibility profiles. The points indicate the data from different segments, and the dashed line represents a root mean square fit. Note that for RCI, a logarithmic scale is employed.

Table 1 The species considered, PDB ID numbers of structures employed for MD simulations, the corresponding residue sequences, the total number of MD trajectories analyzed, and the BMRB accession numbers of NMR chemical shifts employed to derive the RCI profiles
Supplemental material

Additional material

Download Zip (1.4 MB)

Reprints and Corporate Permissions

Please note: Selecting permissions does not provide access to the full text of the article, please see our help page How do I view content?

To request a reprint or corporate permissions for this article, please click on the relevant link below:

Academic Permissions

Please note: Selecting permissions does not provide access to the full text of the article, please see our help page How do I view content?

Obtain permissions instantly via Rightslink by clicking on the button below:

If you are unable to obtain permissions via Rightslink, please complete and submit this Permissions form. For more information, please visit our Permissions help page.