954
Views
25
CrossRef citations to date
0
Altmetric
Research Paper

Memory Processes in the Response of Plants to Environmental Signals

, , , &
Pages 9-14 | Published online: 12 Jan 2006

Figures & data

Figure 1 Experimenting with Bidens seedlings. (A) Normal Bidens seedling exhibiting bilateral symmetry. TB = terminal (or “apical”) bud, C1 and C2 = (opposite) cotyledons, AB1 and AB2 = axillary (i.e., “cotyledonary”) buds of cotyledons C1 and C2, H = hypocotyl, R = root. (B) When the terminal bud was removed (seedling “decapitation”), the axillary buds of the cotyledons started to grow (release of apical dominance). They grew at approximately the same rate under optimal conditions of mineral nutrition and photosynthesis. One of them started to grow significantly faster that the other under nonoptimal conditions (not shown). (C) Under nonoptimal conditions, a few needle pricks, P, were applied to one of the cotyledons of nondecapitated seedlings. (D) This gave (after release of apical dominance) a statistical advantage to the axillary bud of the opposite cotyledon (distal bud) to be the first to start to grow. This advantage was measured using an index, g, with − 1 ≤ g ≤ + 1. If, in a set of Bidens seedlings, it was always the distal bud which was the first to start to grow, then g = + 1. In a case in which the bud at the axil of the pricked cotyledon (proximal bud) would always be the first to start to grow, then g would be equal to − 1 (not shown). In a case in which there would be an approximately equal number of seedlings where it was the proximal or the distal bud which was the first to start to grow, then g # 0 (not shown). Substituting an asymmetrical nonwounding treatment (such as gently rubbing one of the cotyledons) for the asymmetrical pricking treatment would not change the result as measured by the g-value (not shown). Note that, at a given time, the length of a growing bud can be very different from one seedling to another; only the relative growth of the two cotyledonary buds of each seedling thus has to be taken into consideration in these experiments. (Figure modified from Thellier et al.Citation27).
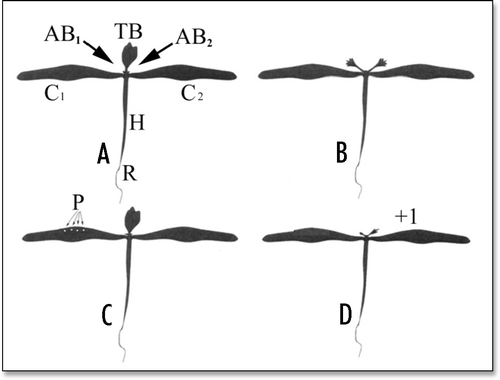
Figure 1 Experimenting with Bidens seedlings. (A) Normal Bidens seedling exhibiting bilateral symmetry. TB = terminal (or “apical”) bud, C1 and C2 = (opposite) cotyledons, AB1 and AB2 = axillary (i.e., “cotyledonary”) buds of cotyledons C1 and C2, H = hypocotyl, R = root. (B) When the terminal bud was removed (seedling “decapitation”), the axillary buds of the cotyledons started to grow (release of apical dominance). They grew at approximately the same rate under optimal conditions of mineral nutrition and photosynthesis. One of them started to grow significantly faster that the other under nonoptimal conditions (not shown). (C) Under nonoptimal conditions, a few needle pricks, P, were applied to one of the cotyledons of nondecapitated seedlings. (D) This gave (after release of apical dominance) a statistical advantage to the axillary bud of the opposite cotyledon (distal bud) to be the first to start to grow. This advantage was measured using an index, g, with − 1 ≤ g ≤ + 1. If, in a set of Bidens seedlings, it was always the distal bud which was the first to start to grow, then g = + 1. In a case in which the bud at the axil of the pricked cotyledon (proximal bud) would always be the first to start to grow, then g would be equal to − 1 (not shown). In a case in which there would be an approximately equal number of seedlings where it was the proximal or the distal bud which was the first to start to grow, then g # 0 (not shown). Substituting an asymmetrical nonwounding treatment (such as gently rubbing one of the cotyledons) for the asymmetrical pricking treatment would not change the result as measured by the g-value (not shown). Note that, at a given time, the length of a growing bud can be very different from one seedling to another; only the relative growth of the two cotyledonary buds of each seedling thus has to be taken into consideration in these experiments. (Figure modified from Thellier et al.Citation27).

Figure 2 DNA content (expressed as histograms of percentage of cells) of cell nuclei from the meristems of cotyledonary buds of Bidens seedlings subjected to an asymmetrical, pricking stimulus. The date when seedling germination began was termed day 0. On day 15, the seedlings were pricked four times at the base of one of their two cotyledons. The seedlings were not decapitated (i.e., the cotyledonary buds remained quiescent). Symbols “P” and “D” represent the proximal and distal buds and symbols “T” and “C” the seedlings subjected to the pricking treatment and the non-pricked controls. The DNA measurements were made on day 16 (left row of histograms) and day 20 (right row of histograms) in the buds of nonpricked controls (C16 and C20) and in the proximal (P-T16 and P-T20) and the distal (D-T16 and D-T20) buds of pricked seedlings. The DNA contents were expressed in arbitrary units (AU). In a few cells undergoing cell division, the DNA content was approximately 45 AU in metaphase cell nuclei and 22 AU at each pole of cell nuclei in telophase. In each histogram, the cells on the left and on the right of the vertical, dashed lines at 32 AU may thus be considered to be in (or close to) the G1 and G2 phases of the cell cycle, respectively. In the nonpricked controls (C16 and C20) there were an appreciable percentage of cells with DNA content above 32 AU. In the pricked seedlings, one day after treatment, in the proximal bud (P-T16) almost 100% of the cells exhibited DNA contents less than 32 AU, while, in the distal bud (D-T16) the decrease in the proportion of cells with a high nuclear content was less pronounced. All these features were more-or-less maintained over the next four days, with P-T20 not being very different from P-T16 nor D-T20 from D-T16. This means that (1) the signal sent from the pricked cotyledon caused virtually all the cells in (or close to) G2 to divide in the proximal bud, (2) the effect was much less in the distal bud (storage of a symmetry-breaking information?) and (3) the cell cycle then virtually ceased to evolve during at least the four subsequent days. (Figure modified from Desbiez et al.Citation20).
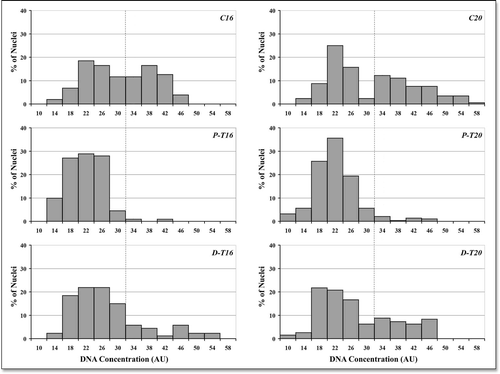
Figure 2 DNA content (expressed as histograms of percentage of cells) of cell nuclei from the meristems of cotyledonary buds of Bidens seedlings subjected to an asymmetrical, pricking stimulus. The date when seedling germination began was termed day 0. On day 15, the seedlings were pricked four times at the base of one of their two cotyledons. The seedlings were not decapitated (i.e., the cotyledonary buds remained quiescent). Symbols “P” and “D” represent the proximal and distal buds and symbols “T” and “C” the seedlings subjected to the pricking treatment and the non-pricked controls. The DNA measurements were made on day 16 (left row of histograms) and day 20 (right row of histograms) in the buds of nonpricked controls (C16 and C20) and in the proximal (P-T16 and P-T20) and the distal (D-T16 and D-T20) buds of pricked seedlings. The DNA contents were expressed in arbitrary units (AU). In a few cells undergoing cell division, the DNA content was approximately 45 AU in metaphase cell nuclei and 22 AU at each pole of cell nuclei in telophase. In each histogram, the cells on the left and on the right of the vertical, dashed lines at 32 AU may thus be considered to be in (or close to) the G1 and G2 phases of the cell cycle, respectively. In the nonpricked controls (C16 and C20) there were an appreciable percentage of cells with DNA content above 32 AU. In the pricked seedlings, one day after treatment, in the proximal bud (P-T16) almost 100% of the cells exhibited DNA contents less than 32 AU, while, in the distal bud (D-T16) the decrease in the proportion of cells with a high nuclear content was less pronounced. All these features were more-or-less maintained over the next four days, with P-T20 not being very different from P-T16 nor D-T20 from D-T16. This means that (1) the signal sent from the pricked cotyledon caused virtually all the cells in (or close to) G2 to divide in the proximal bud, (2) the effect was much less in the distal bud (storage of a symmetry-breaking information?) and (3) the cell cycle then virtually ceased to evolve during at least the four subsequent days. (Figure modified from Desbiez et al.Citation20).

Figure 3 Experimenting with flax seedlings. (Top) Time course of the experiments. Flax seeds were germinated during three days in the dark then under light. The seedlings were stimulated (manipulation stress, drought, wind, cold shock or radiation from a GSM telephone or from a 105 GHz Gunn oscillator) for instance on the 4th day then they were subjected to transient calcium depletion (beginning for instance at the moment when the stimulus was applied). Seedlings were sampled during the following 20 days or so, for counting the epidermal meristems appearing in the hypocotyls. (Bottom) Scheme of the flax seedlings and enlargement of a zone of the hypocotyl showing the view of an epidermal meristem.
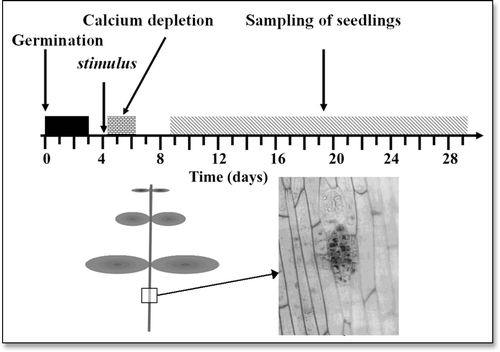
Figure 3 Experimenting with flax seedlings. (Top) Time course of the experiments. Flax seeds were germinated during three days in the dark then under light. The seedlings were stimulated (manipulation stress, drought, wind, cold shock or radiation from a GSM telephone or from a 105 GHz Gunn oscillator) for instance on the 4th day then they were subjected to transient calcium depletion (beginning for instance at the moment when the stimulus was applied). Seedlings were sampled during the following 20 days or so, for counting the epidermal meristems appearing in the hypocotyls. (Bottom) Scheme of the flax seedlings and enlargement of a zone of the hypocotyl showing the view of an epidermal meristem.

Figure 4 (A–D) A typical example of the time course of the production of epidermal meristems in flax hypocotyls. The seedlings were given a manipulation stimulus (↓) on day 4 (curves A–C) and they were subjected to transient calcium depletion (−) beginning on days 4 (curves A and D), 8 (curve B) or 12 (curve C). In each case, 10 seedlings were sampled per day up to the 30th day and the curves represent the mean number of epidermal meristems produced per seedling. For the seedlings subjected to both the manipulation stimulus and the transient calcium depletion (curves A–C), it appears clearly (1) that the final number of meristems per seedling was always approximately the same (12–14 in this present case) but that delaying the calcium depletion treatment relative to the manipulation stimulus resulted in correspondingly delaying the production of meristems and (2) that the number of meristems produced in the nonstimulated controls (curve D) was always very low (″ 2 in this present case). (Figure modified from Verdus et al.Citation16).
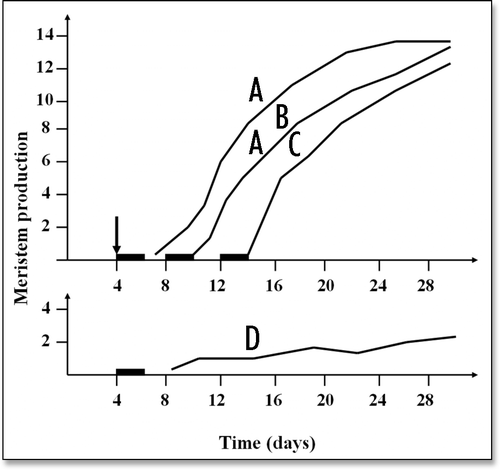
Figure 4 (A–D) A typical example of the time course of the production of epidermal meristems in flax hypocotyls. The seedlings were given a manipulation stimulus (↓) on day 4 (curves A–C) and they were subjected to transient calcium depletion (−) beginning on days 4 (curves A and D), 8 (curve B) or 12 (curve C). In each case, 10 seedlings were sampled per day up to the 30th day and the curves represent the mean number of epidermal meristems produced per seedling. For the seedlings subjected to both the manipulation stimulus and the transient calcium depletion (curves A–C), it appears clearly (1) that the final number of meristems per seedling was always approximately the same (12–14 in this present case) but that delaying the calcium depletion treatment relative to the manipulation stimulus resulted in correspondingly delaying the production of meristems and (2) that the number of meristems produced in the nonstimulated controls (curve D) was always very low (″ 2 in this present case). (Figure modified from Verdus et al.Citation16).

Figure 5 Time courses of the change in the position of the protein spot “Toucher1” in the gels and of the change in the 31P/12C ratio in this protein, after application of a manipulation stimulus to the seedlings under study. At the times (min) 0, 5, 10, 30, 60 and 120, the white arrows indicate the position of the “Toucher 1” spot in the gels. At the same time-values the curve represents the changes in the 31P/12C ratio in this particular protein spot. Although nonnegligible error bars exist, it is obvious that the change of the pI shift of this spot is strongly correlated with a change in the phosphorylation status of the corresponding protein.
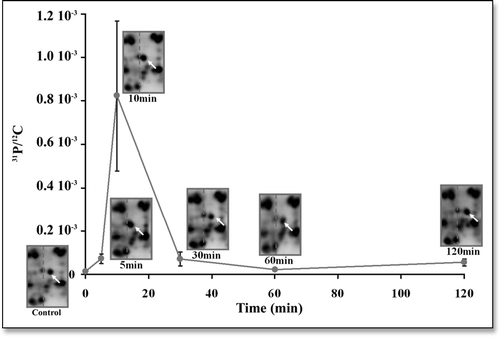
Figure 5 Time courses of the change in the position of the protein spot “Toucher1” in the gels and of the change in the 31P/12C ratio in this protein, after application of a manipulation stimulus to the seedlings under study. At the times (min) 0, 5, 10, 30, 60 and 120, the white arrows indicate the position of the “Toucher 1” spot in the gels. At the same time-values the curve represents the changes in the 31P/12C ratio in this particular protein spot. Although nonnegligible error bars exist, it is obvious that the change of the pI shift of this spot is strongly correlated with a change in the phosphorylation status of the corresponding protein.

Table 1 Early changes in flax proteins induced by different types of treatments

Table 2 Early changes in Arabidopsis proteins as induced by cold shock or radiation from a GSM telephone

Reprints and Corporate Permissions

Please note: Selecting permissions does not provide access to the full text of the article, please see our help page How do I view content?

To request a reprint or corporate permissions for this article, please click on the relevant link below:

Academic Permissions

Please note: Selecting permissions does not provide access to the full text of the article, please see our help page How do I view content?

Obtain permissions instantly via Rightslink by clicking on the button below:

If you are unable to obtain permissions via Rightslink, please complete and submit this Permissions form. For more information, please visit our Permissions help page.