Figures & data
Figure 1. HAB1 fails to efficiently dephosphorylate the bulk of SnRK2.6 auto-phosphorylation sites. Ten µM SnRK2.6 were incubated with [32P]-γ-ATP and either 10 µM HAB1 (A) or 0.3 units calf intestine phosphatase (CIP) (B) for the indicated amount of time. The SnRK2.6 phosphorylation can be efficiently removed by CIP but not by HAB1. Reactions were terminated by boiling in SDS sample buffer, separated by SDS PAGE, and subjected to autoradiography. (C). Cartoon presentation of the selective SnRK2.6 activation loop dephosphorylation in the HAB1 catalytic cleft. S, Ser/Thr phosphate acceptor residues; P, phosphate.
![Figure 1. HAB1 fails to efficiently dephosphorylate the bulk of SnRK2.6 auto-phosphorylation sites. Ten µM SnRK2.6 were incubated with [32P]-γ-ATP and either 10 µM HAB1 (A) or 0.3 units calf intestine phosphatase (CIP) (B) for the indicated amount of time. The SnRK2.6 phosphorylation can be efficiently removed by CIP but not by HAB1. Reactions were terminated by boiling in SDS sample buffer, separated by SDS PAGE, and subjected to autoradiography. (C). Cartoon presentation of the selective SnRK2.6 activation loop dephosphorylation in the HAB1 catalytic cleft. S, Ser/Thr phosphate acceptor residues; P, phosphate.](/cms/asset/a3569f52-b59b-44e2-9708-f93d9eb36f91/kpsb_a_10919694_f0001.gif)
Figure 2. PP2C catalytic mechanism. (A) SnRK2.6–HAB1 crystal structure interaction map, in which the sulfate group mimics the phosphate group cleaved from SnRK2.6 S175. This represents the functional correlate of the post-reaction status, at which the phosphate group has been transferred to HAB1 R199. Pink: HAB1, green: SnRK2.6. The sulfate ion is shown in ball presentation, the Mg2+-ions as solid gray balls. (B) Schematic presentation of the reaction mechanism. Mg2+ binds to the phosphate group of the phosphorylated serine, thereby increasing the partial positive charge of the phosphorus atom and facilitating a SN2 nucleophilic attack by the water molecule. E203 partly deprotonizes the water molecule and increases its nucleophilicity for attacking the phosphorus atom. R199 from the PP2C then binds the leaving phosphate group by charge interaction, and removes it from the substrate (SnRK2) molecule. (C) Phosphatase activity of wildtype (WT) HAB1 and HAB1 proteins in which key catalytic residues were altered to alanines. Activities are shown in the absence and presence of 10 mM of the PP2C inhibitor NaF. Error bars indicate SD (n = 3).
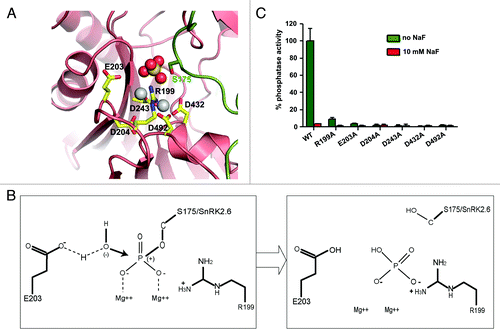
Figure 3. SnRK2.6 does not inhibit HAB1 activity in the SnRK2.6–HAB1 complex. (A) 0.4 µM HAB1 were preincubated with increasing amounts of SnRK2.6 and then subjected to a phosphatase reaction with 100 µM of a SnRK2.6 activation loop phosphopeptide substrate. Error bars indicate SD (n = 6). (B) Control kinase reaction demonstrating that both SnRK2.6 and HAB1 preparations were active and formed functional complexes. 0.4 µM SnRK2.6 were preincubated with increasing amounts of HAB1 for 30 min and then subjected to a [32P]-γ-ATP kinase reaction.
![Figure 3. SnRK2.6 does not inhibit HAB1 activity in the SnRK2.6–HAB1 complex. (A) 0.4 µM HAB1 were preincubated with increasing amounts of SnRK2.6 and then subjected to a phosphatase reaction with 100 µM of a SnRK2.6 activation loop phosphopeptide substrate. Error bars indicate SD (n = 6). (B) Control kinase reaction demonstrating that both SnRK2.6 and HAB1 preparations were active and formed functional complexes. 0.4 µM SnRK2.6 were preincubated with increasing amounts of HAB1 for 30 min and then subjected to a [32P]-γ-ATP kinase reaction.](/cms/asset/e65bc7f7-6f66-4906-9dfb-b60eea2fbdbe/kpsb_a_10919694_f0003.gif)
Figure 4. Structural mechanism for HAB1 inhibition. (A) Surface presentation of the HAB1 catalytic cleft overlaid with a cartoon presentation of the PYL2 gate loop (blue) and the SnRK2.6 activation loop (green). The gate loop S89 and activation loop S175 are shown as stick presentation. The catalytic Mg2+ ions are indicated as white spheres. (B and C) PYL2 gate loop with S89 in stick presentation (B) and SnRK2.6 activation loop with S175 in stick presentation (C) in the HAB1 catalytic center. Panel C is the same as panel A in and shown for direct comparison.
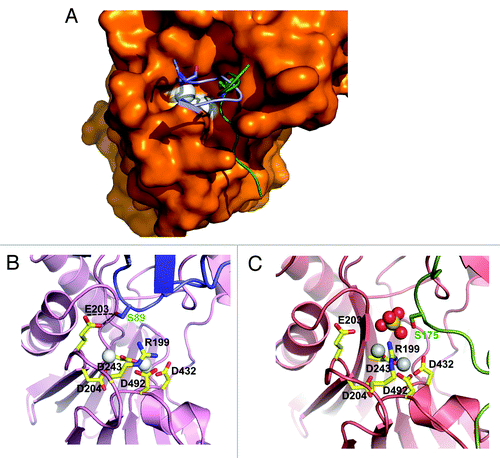
Figure 5. Both ABA-signaling and non-ABA-signaling SnRK2s interact with PP2Cs. (A) Sequence alignment of the A. thaliana SnRK2 proteins. The residues corresponding to the HAB1-interaction residues of SnRK2.6, including the whole ABA box, are boxed. Negatively charged residues are shown in red, positively charged residues in blue. (B) AlphaScreen interaction between the ABA box regions of the ten A. thaliana SnRK2 proteins fused to H6GST and biotin-MBP-tagged HAB1. Error bars indicate SD (n = 3).
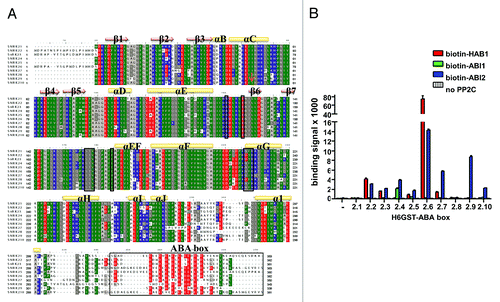
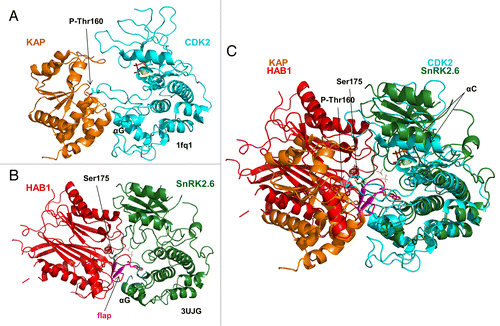
Figure 6. The SnRK2.6–HAB1 and CDK2–KAP kinase–phosphatase complexes share similar binding characteristics. (A) Cartoon structure of the CDK2–KAP complex (PDB code: 1fq1). KAP is colored brown and CDK2 blue. Mg2+ and the ATP analog AMP-PNP are shown in dot and stick presentation, respectively, in the catalytic cleft of CDK2. P-Thr160 in the CDK2 activation loop is shown in stick presentation. (B) Cartoon structure of the SnRK2.6–HAB1 complex (PDB code: 3UJG). HAB1 is colored red, the HAB1 flap region magenta, and SnRK2.6 green. The catalytic Mg2+ ions in the HAB1 cleft are shown as dots and Ser175 in the SnRK2.6 activation loop in stick presentation. (C) Structural overlay of the CDK2–KAP and SnRK2.6–HAB1 complexes. The same color code is used as in (A) and (B).