Figures & data
Figure 1. Model showing the role of REV targets in shade avoidance and leaf development. Using a ChIP-Seq approach we have previously shown that REV acts upstream of both HD-ZIPII and auxin biosynthesis. Thereby REV influences shade-induced growth responses. Here we show that HD-ZIPII transcription factors also have a prominent role in regulating leaf development. It is unknown whether and how HD-ZIPIIIs are activated by shade and whether TAA1/YUC5 play a role in leaf development.
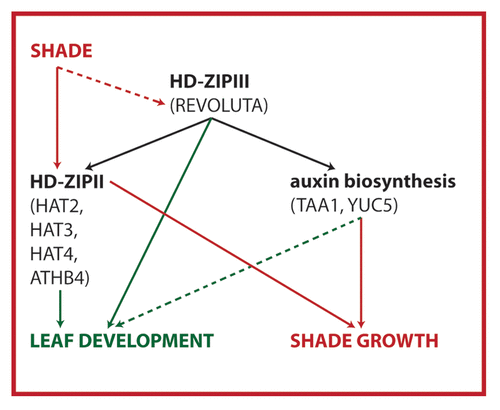
Figure 2. Mutations in both HD-ZIPII and HD-ZIPIII genes cause polarity defects in leaves and vascular organization. (A) Comparative growth analysis of different mutant plants. The triangle highlights abaxialized leaves of rev-5, 35S::miR165a, 35S::ZPR3 and athb4 hat3 plants. In wild type Col-0 and hat1 hat2 plants no growth abnormalities were observed. Below the photographs of wild type and the different mutant plants, sections through petioles are shown. The vasculature of wild type Col-0 plants shows the typical sandwich structure tissue containing phloem cells (green), cambium cells (red) and tissue containing xylem elements (blue) on top. Both 35S::miR165a and 35S::ZPR3 transgenic plants show abaxialized vascular strands with phloem nearly surrounding the xylem. In athb4 hat3 mutant plants, the vascular organization is severely disturbed but is also showing abaxialized characteristics. (B) In the juvenile phase of post-embryonic growth, athb4 hat3 double mutants produce radial leaves in comparison to Col-0 wild type plants. Later in development (around 6 weeks after germination; lower panel), leaves with weaker abaxialized characteristics, such as downward bending leaf blade, are being produced.
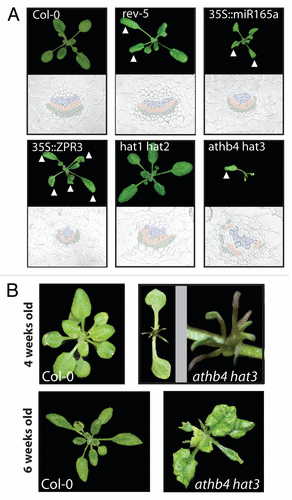
Figure 3. Mutations in HD-ZIPII genes cause abnormal growth and polarity defects in cotyledons and leaves. (A-D) Scanning Electron Microcopy images showing wild-type and athb4 hat3 mutant seedlings on days 3 and 5. Phenotypes of wild type (A, C, E, G) and athb4 hat3 (B, D, F, H) seedlings on day 3 (cotyledons: A, B), day 5 (primary leaves: B, D), day 7 (cotyledons: E, F) and day 10 (primary leaves: G, H). (I) Confocal microscopy images showing a transversal section of a wild-type (left) and athb4 hat3 (right) cotyledon to visualize the different types of cells. (J) 3D-reconstruction using the Osirix software from image sections of wild-type (left) and athb4 hat3 (right) seedlings. Images were taken from 1-d-old seedlings. Mutant seedlings lack mostly palisade cells, suggesting they are missing adaxial identity. Bar size corresponds to 0.5 (A, B), 0.2 (C, D), 1 (E, F) and 0.3 (G, H) mm. (K) Real-time quantitative PCR (qPCR) experiments showing expression changes of PHB and PHV in Col-0 and athb4 hat3 mutant seedlings. Transcript abundance is measured relative to Col-0 values. Values are means ± SE of three (Col-0) or five (athb4 hat3) independent biological qPCR replicates normalized to UBQ10. Asterisk indicate significant differences (p < 0.01) relative to the Col-0 plants growing under the same conditions.
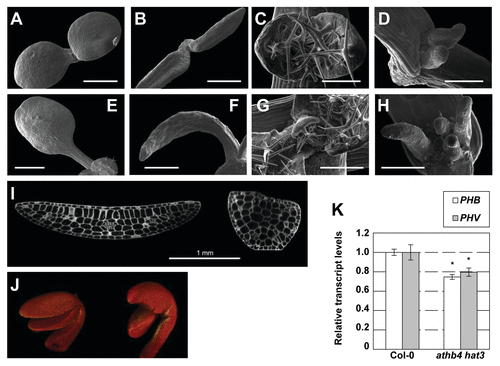
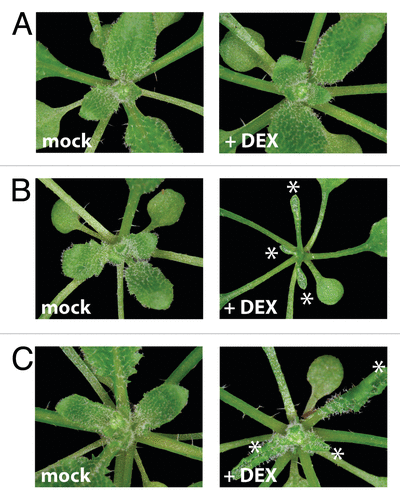
Figure 4. Inducible overexpression lines of either REVOLUTA or HAT3 cause similar developmental alterations in leaf formation. Four-week old soil-grown seedlings treated for one week with either Dexamethasone or a mock solution by spraying. Strongly adaxialized leaves (see asterisks) were observed in DEX-treated 35S::FLAG-GR-HAT3 (B) and 35S::FLAG-GR-REVd(C) plants in comparison to Col-0 wild type plants (A).