Figures & data
Figure 1. I. Cortical MTs organization in epidermal cells of A. thaliana in 2 h after the UV-B exposure: А − leaf, control; A' − leaf, 27.2 kJ/m2; A'' − leaf, 68 kJ/m2; B -hypocotyl, control; B' − hypocotyl, 27.2 kJ/m2; B'' − hypocotyl, 68 kJ/m2; C' − primary root transition zone, control; C' -primary root transition zone, 27.2 kJ/m2; C'' − primary root transition zone, 68 kJ/m2. Bar - 20 μm. II. A. thaliana primary roots growth after the direct exposure of both shielded and non-shielded seedlings to UV-B (27,2 and 68 kJ/m2). III. Primary roots morphology of shielded A. thaliana seedlings in 24 h after exposure to UV-B (27.2 and 68 kJ/m2): А − control; B - 27.2 kJ/m2; C − 68 kJ/m2. Bar - 200 μm.
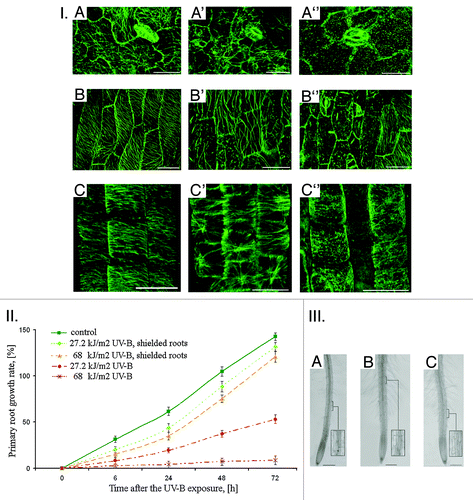
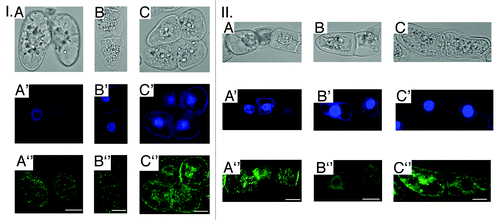
Figure 2. Alterations of general ВУ-2 cells morphology, nuclei shape and interphase MTs organization in 3 h after the UV-B exposure (A - 34 kJ/m2; B - 81 kJ/m2;C -135 kJ/m2): I. A-C - cytoplasm shrinkage; A'-C'- chromatin condensation, DAPI (4',6-diamidino-2-phenylindole) nuclei staining; A”-C” - МТs randomization/depolymerization. II. A-C - cytoplasm vacuolization; A'-C'- micronuclei formation, DAPI staining; A”-C” - МТs randomization/depolymerization. Bar - 50 μm.