Figures & data
Figure 1. Structural analysis of rice xylan by NMR spectroscopy. Xylooligosaccharides generated by β-endoxylanase digestion of alkaline-extracted xylan were subjected to 1H-NMR analysis. Resonances are labeled with the position of the assigned proton and the identity of the residue containing that proton. The NMR spectrum of Arabidopsis xylan was included for comparison. The proton resonances shared by both Arabidopsis and rice xylans are marked by vertical red lines. The resonances of H1 of α-D-GalA, H1 of α-L-Rha, H1 of 3-linked β-D-Xyl, H4 of α-D-GalA, and H2 of α-L-Rha (arrow heads) from the reducing end tetrasaccharide sequence of Arabidopsis xylan was not observed in rice xylan. Note the predominant resonances corresponding to 2- and 3-linked α-arabinose in rice xylan, which is absent in Arabidopsis xylan. HDO, hydrogen deuterium oxide.
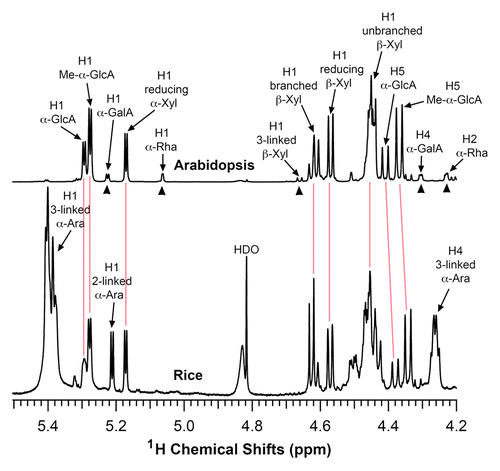
Figure 2. Biochemical properties of xylan xylosyltransferase activity in microsomes from rice stems. The xylosyltransferase activity was assayed by incubating microsomes with the UDP-[14C]-xylose donor and the Xyl4 acceptor for 30 min unless otherwise indicated. The activity (CPM) was measured by the transfer of the radiolabeled xylosyl group onto the acceptor. All assays were repeated twice and the data are means ± SE of assays from 3 independently isolated microsomes. (A) Dependence of the xylosyltransferase activity on the Xyl4 acceptor concentration. (B) Time course of the transfer of the radiolabeled xylosyl residues onto the acceptor by the xylosyltransferase activity. (C) The xylosyltransferase activity is protein concentration-dependent.
![Figure 2. Biochemical properties of xylan xylosyltransferase activity in microsomes from rice stems. The xylosyltransferase activity was assayed by incubating microsomes with the UDP-[14C]-xylose donor and the Xyl4 acceptor for 30 min unless otherwise indicated. The activity (CPM) was measured by the transfer of the radiolabeled xylosyl group onto the acceptor. All assays were repeated twice and the data are means ± SE of assays from 3 independently isolated microsomes. (A) Dependence of the xylosyltransferase activity on the Xyl4 acceptor concentration. (B) Time course of the transfer of the radiolabeled xylosyl residues onto the acceptor by the xylosyltransferase activity. (C) The xylosyltransferase activity is protein concentration-dependent.](/cms/asset/212834c1-51e7-49d0-9d17-17d94fe1dbc6/kpsb_a_10927809_f0002.gif)
Figure 3. Xylooligomers of various lengths as acceptors for the xylosyltransferase activity of rice microsomes. The xylosyltransferase activity was assayed by incubating rice stem microsomes with UDP-xylose and the acceptor Xyl1-AA, Xyl2-AA, Xyl3-AA, Xyl4-AA, Xyl5-AA, or Xyl6-AA, and the reaction products were analyzed by reverse-phase HPLC and detected for fluorescent signals. The number at each peak denotes the number of xylosyl residues for the corresponding xylooligomer. A chromatogram of standard Xyl1–6-AA is shown at the top of each column for comparison of the xylooligomer peaks.
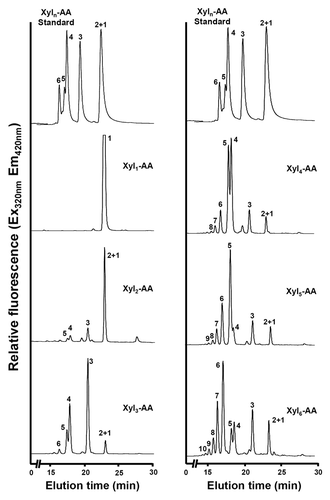
Figure 4. Digestion of the xylosyltransferase-catalyzed reaction products by β-1,4-xylosidase. Microsomes were incubated with the fluorescent Xyl6-AA acceptor and UDP-xylose. The reaction products were digested with β-1,4-xylosidase and then analyzed by reverse-phase HPLC. (A) The control reaction without UDP-xylose showing the Xyl6-AA acceptor peak. (B) Rice microsomes possess the xylosyltransferase activity capable of adding xylosyl residues onto the Xyl6-AA acceptor peak. (C) β-1,4-Xylosidase digestion of the reaction products from (B) results in their degradation into Xyl1-AA and Xyl2-AA, indicating that the reaction products are β-1,4-linked. The number at each peak denotes the number of xylosyl residues for the corresponding xylooligomer.
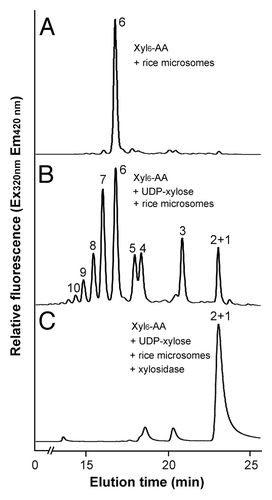
Figure 5. Phylogenetic analysis of rice and Arabidopsis family GT43 proteins (A), exon-intron organization (B) and expression patterns (C) of OsGT43 genes. (A) The GT43 amino acid sequences were aligned using ClustalW and their phylogenetic relationship was analyzed using the neighbor-joining method in MEGA5.2 (Tamura et al., 2011). Bootstrap values resulted from 1,000 replicates are shown at the nodes. (B) Open boxes and lines denote exons and introns, respectively. The bar scale shows the number of nucleotides. (C) The expression of OsGT43 genes in various tissues shown as the heat map was from Li et al.Citation50 Shoot and root tissues are from 2-week-old shoots and roots of rice (Oryza sativa Japonica Nipponbare).
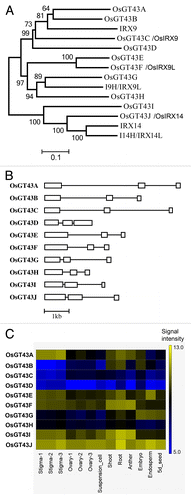
Figure 6. Subcellular localization of OsGT43 proteins. Fluorescent protein-tagged fusion proteins were expressed in Arabidopsis protoplasts, and the signals were visualized with a laser confocal microscope. (A) OsGT43A, OsGT43E, OsGT43H and OsGT43J are membrane proteins as predicted by the TMHMM2.0 program. Inside, the cytoplasmic side of the membrane; outside, the noncytoplasmic side of the membrane. (B) and (C) An Arabidopsis leaf protoplast (B) expressing YFP alone showing the fluorescent signals throughout the cytoplasm (C). (D) to (G) An Arabidopsis protoplast (D) co-expressing OsGT43A-YFP (E) and the Golgi-localized FRA8-CFP (F). (H) to (K) An Arabidopsis protoplast (H) co-expressing OsGT43E-YFP (I) and FRA8-CFP (J). (L) to (O) An Arabidopsis protoplast (L) co-expressing OsGT43H-YFP (M) and FRA8-CFP (N). (P) to (S) An Arabidopsis protoplast (P) co-expressing OsGT43J-YFP (Q) and FRA8-CFP (R). Note the superimposition of the fluorescent signals of OsGT43-YFP with FRA8-CFP (G, K, O, and S).
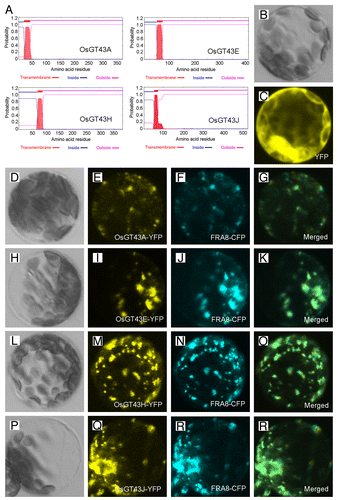
Figure 7. Complementation of the irx9 and irx14 mutants by expression of OsGT43 genes. Rice GT43 cDNAs driven by the CaMV 35S promoter were introduced into irx9 or irx14 and the bottom parts of inflorescence stems of 10-wk-old transgenic overexpressors were examined for the stem breaking strength (B) and vessel morphology (C to N). Bar in (C) = 97 μm in (C) to (N). (A) Reverse transcription PCR analysis of expression of OsGT43 genes in 8 representative lines of transgenic irx9 or irx14 plants. The expression of the EF1α gene was used as an internal control. (B) Measurement of stem breaking strength of the wild type, irx9, irx14, and the mutants expressing OsGT43 genes. Each bar represents the breaking force of the inflorescence stem of individual plants. (C) to (H) The collapsed vessel phenotype (arrows) in irx9 (C) was rescued by expression of OsGT43A (D) and OsGT43E (E) but not OsGT43H (F) and OsGT43J (G). (I) to (N) The collapsed vessel phenotype (arrows) in irx14 (I) was rescued by expression of OsGT43J (M) but not OsGT43A (J), OsGT43E (K), and OsGT43H (L).
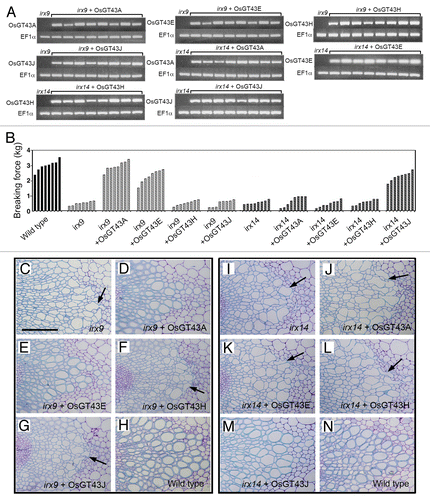
Table 1. Cell wall composition analysis of the irx9 and irx14 plants expressing rice GT43 genes
Figure 8. Measurement of cellulose and lignin amounts in irx9 and irx14 expressing OsGT43 genes. Cell walls were isolated from pooled mature inflorescence stems of 8 independent transgenic lines for each construct and used for measurement of the amounts of cellulose (A), guaiacyl lignin (B) and syringyl lignin (C). The data are mean ± SE of 2 separate assays. Note that expression of OsGT43A and OsGT43E in irx9 restored cellulose, guaiacyl lignin and syringyl lignin to the wild-type level and that expression of OsGT43J in irx14 restored cellulose, guaiacyl lignin and syringyl lignin to the wild-type level.
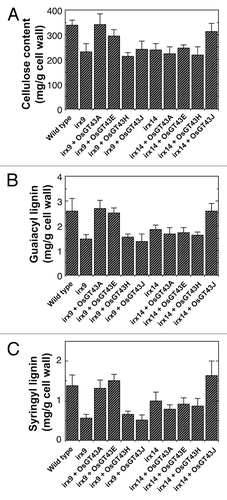
Figure 9. MALDI-TOF mass spectra of xylooligosaccharides generated by xylanase digestion of xylans from the wild type, irx9, irx14, and the mutants expressing OsGT43 genes. The ions at m/z 745 and 759 in the wild type (A and G) correspond to xylotetrasaccharides bearing a GlcA residue (X4G) or a methylated GlcA residue (X4M). (A) to (F) The missing ion at m/z 745 corresponding to X4G in irx9 (B) was partially restored by expression of OsGT43A (C) and OsGT43E (D) but not OsGT43H (E) and OsGT43J (F). (G) to (L) The missing ion at m/z 745 corresponding to X4G in irx14 (H) was restored by expression of OsGT43J (L) but not OsGT43A (I), OsGT43E (J), and OsGT43H (K).
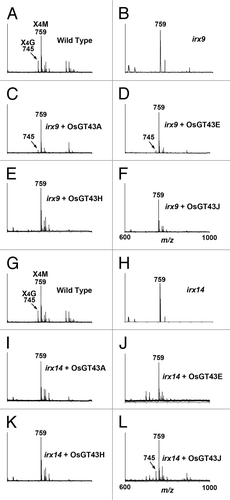
Figure 10.1H-NMR spectra of xylooligosaccharides generated by xylanase digestion of xylans from the wild type, irx9, irx14, and the mutants expressing OsGT43 genes. Resonances are labeled with the position of the assigned proton and the identity of the residue containing that proton. Note the restoration of the resonance of H1 of α-GlcA in irx9 complemented with OsGT43A and OsGT43E and in irx14 complemented with OsGT43J. The resonances of H1 of α-D-GalA, H1 of α-L-Rha, H1 of 3-linked β-D-Xyl, H4 of α-D-GalA, and H2 of α-L-Rha (arrow heads) are from the GX reducing end tetrasaccharide sequence. Note the relatively elevated resonance intensities of the GX reducing end tetrasaccharide sequence in irx 9 and irx14 compared with the wild type and the reduction in the intensity of these resonances in irx9 complemented with OsGT43A and OsGT43E and in irx14 complemented with OsGT43J.
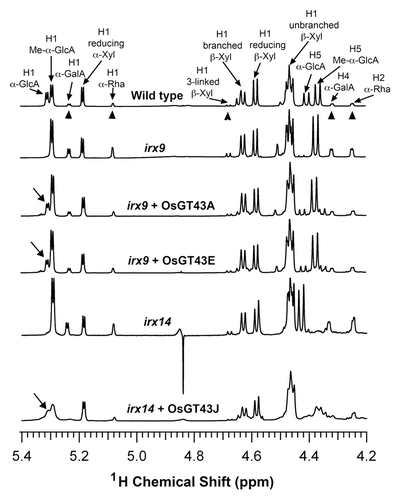
Table 2. Relative abundance of the reducing end sequence and the DP of xylan in the irx9 and irx14 plants expressing rice GT43 genes
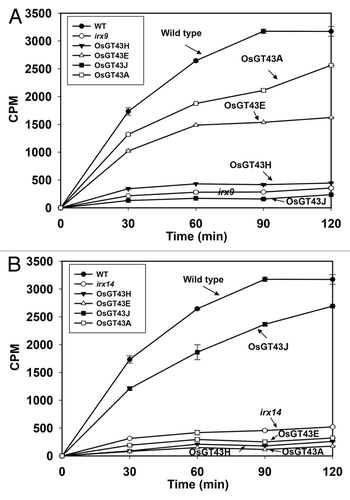
Figure 11. Time course of the xylosyltransferase activity in the microsomes from the wild type, irx9, irx14, and the mutants expressing OsGT43 genes. Microsomes were isolated from stems of 8 independent transgenic lines for each construct. The isolated microsomes were incubated with radiolabeled UDP-xylose and the Xyl4 acceptor, and the xylosyltransferase activity (CPM) was measured by the amount of radiolabeled xylosyl residues transferred onto the acceptor. The data are mean ± SE of 3 technical replicates. (A) Restoration of the xylosyltransferase activity in irx9 by expression of OsGT43A and OsGT43E but not OsGT43H and OsGT43J. (B) Restoration of the xylosyltransferase activity in irx14 by expression of OsGT43J but not OsGT43A, OsGT43E and OsGT43H.
