998
Views
3
CrossRef citations to date
0
Altmetric
RESEARCH PAPER

A genetic screen for mutants defective in IAA1-LUC degradation in Arabidopsis thaliana reveals an important requirement for TOPOISOMERASE6B in auxin physiology

&
Article: e972207 | Received 19 Jun 2014, Accepted 07 Jul 2014, Published online: 22 Dec 2014

Figures & data

Figure 1. top6b-7 has higher levels of IAA1-LUC and a slower IAA1-LUC degradation rate. (A) Confirmation of higher IAA1-LUC steady-state levels and co-segregation with the mutant phenotype. An F2 population of seeds from a backcross to the progenitor transgenic IAA1-LUC line was re-screened for the accumulation IAA1-LUC. Seedlings with the top6b phenotype (see ) were separated from wild type seedlings and imaged after pre-incubation with the substrate luciferin. (B) IAA1-LUC degradation rates in top6b-7 and wild type sibling seedlings. Using a single-seedling degradation assayCitation21 IAA1-LUC half-lives (t1/2) were determined in 7 d-old individual mutant and wild-type siblings in an BC2F2 segregating population. In top6b-7 seedlings IAA1-LUC t1/2 = 34.5 min, n = 59. In wild-type siblings IAA1-LUC t1/2 = 17.4 min, n = 180. Bars are standard error. Half-lives are statistically different by a Student's t test (P = 1.16*10−14, α = 0.05).
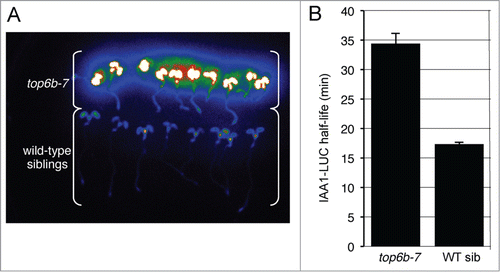
Figure 1. top6b-7 has higher levels of IAA1-LUC and a slower IAA1-LUC degradation rate. (A) Confirmation of higher IAA1-LUC steady-state levels and co-segregation with the mutant phenotype. An F2 population of seeds from a backcross to the progenitor transgenic IAA1-LUC line was re-screened for the accumulation IAA1-LUC. Seedlings with the top6b phenotype (see Fig. 3) were separated from wild type seedlings and imaged after pre-incubation with the substrate luciferin. (B) IAA1-LUC degradation rates in top6b-7 and wild type sibling seedlings. Using a single-seedling degradation assayCitation21 IAA1-LUC half-lives (t1/2) were determined in 7 d-old individual mutant and wild-type siblings in an BC2F2 segregating population. In top6b-7 seedlings IAA1-LUC t1/2 = 34.5 min, n = 59. In wild-type siblings IAA1-LUC t1/2 = 17.4 min, n = 180. Bars are standard error. Half-lives are statistically different by a Student's t test (P = 1.16*10−14, α = 0.05).

Figure 2. Mapping of top6b-7 and identification of the mutation. (A) Positional cloning of top6b-7. For experiment 1, a small mapping population was used to roughly map, and a larger mapping population was used for experiment 2 fine mapping. Markers for mapping are shown with red tick marks. The mutation mapped between PERL0472202 and PERL0473223 SNPS. (B) Identification of mutation in top6b-7. Genomic DNA for At3g20780 was sequenced from 340 bp 5′ of START codon to 270 bp 3′ of the STOP codon. Sequence is shown for exon 1, intron 1, and exon 2 with intron sequence denoted by lowercase type. The G to A mutation in top6b-7 is bold underlined type. (C) Amino acid substitution in top6b-7. The first 100 amino acids of the TOP6B primary sequence are shown. The E36K substitution in top6b-7 is bold underlined type. (D) Multiple sequence alignment of TOP6B N-terminus. TOP6B sequences were retrieved from NCBI, by protein BLAST search using the Arabidopsis protein. Sequences were aligned using ClustalW2 (http://www.ebi.ac.uk/Tools/msa/clustalw2/), and the sequences near the N-terminus are shown. An arrow indicates the glutamate residue changed to a lysine residue in top6b-7. Symbols for organisms are: Pp, Physcomitrella patens; Sm, Selaginella moellendorffii; Vv, Vitis vinifera; Rc, Ricinus communis; At, Arabidopsis thaliana; Sb, Sorghum bicolor; Os, Oryza sativa; Ps, Picea sitchensis; Cr, Chlamydomonas reinhardtii; Ta, Thermosphaera aggregans and; Si, Sulfolobus islandicus. Ta and Si are included to show divergence of plant TOP6B proteins from those of Archaea. (E) Gene structure of TOP6B and allele locations used in this study. The point mutation in top6b-7 is denoted by a small, black triangle. T-DNA insertions are indicated with large, black triangles with allele designated above them. Exons, UTRs, introns, and deletions are indicated by black boxes, white boxes, lines, and a small triangle, respectively. Scale bars represent 100 bp. Graphics were generated with Exon-Intron Graphic Maker (http://wormweb.org/exonintron).
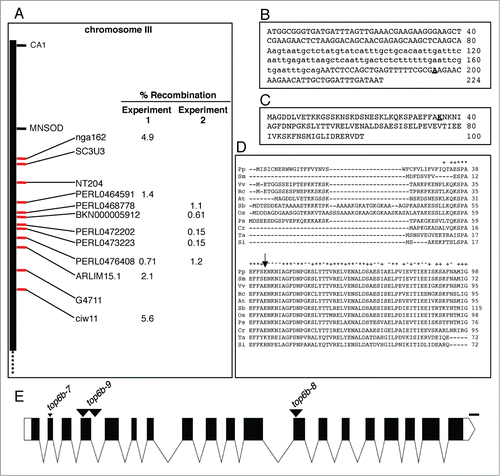
Figure 2. Mapping of top6b-7 and identification of the mutation. (A) Positional cloning of top6b-7. For experiment 1, a small mapping population was used to roughly map, and a larger mapping population was used for experiment 2 fine mapping. Markers for mapping are shown with red tick marks. The mutation mapped between PERL0472202 and PERL0473223 SNPS. (B) Identification of mutation in top6b-7. Genomic DNA for At3g20780 was sequenced from 340 bp 5′ of START codon to 270 bp 3′ of the STOP codon. Sequence is shown for exon 1, intron 1, and exon 2 with intron sequence denoted by lowercase type. The G to A mutation in top6b-7 is bold underlined type. (C) Amino acid substitution in top6b-7. The first 100 amino acids of the TOP6B primary sequence are shown. The E36K substitution in top6b-7 is bold underlined type. (D) Multiple sequence alignment of TOP6B N-terminus. TOP6B sequences were retrieved from NCBI, by protein BLAST search using the Arabidopsis protein. Sequences were aligned using ClustalW2 (http://www.ebi.ac.uk/Tools/msa/clustalw2/), and the sequences near the N-terminus are shown. An arrow indicates the glutamate residue changed to a lysine residue in top6b-7. Symbols for organisms are: Pp, Physcomitrella patens; Sm, Selaginella moellendorffii; Vv, Vitis vinifera; Rc, Ricinus communis; At, Arabidopsis thaliana; Sb, Sorghum bicolor; Os, Oryza sativa; Ps, Picea sitchensis; Cr, Chlamydomonas reinhardtii; Ta, Thermosphaera aggregans and; Si, Sulfolobus islandicus. Ta and Si are included to show divergence of plant TOP6B proteins from those of Archaea. (E) Gene structure of TOP6B and allele locations used in this study. The point mutation in top6b-7 is denoted by a small, black triangle. T-DNA insertions are indicated with large, black triangles with allele designated above them. Exons, UTRs, introns, and deletions are indicated by black boxes, white boxes, lines, and a small triangle, respectively. Scale bars represent 100 bp. Graphics were generated with Exon-Intron Graphic Maker (http://wormweb.org/exonintron).

Table 1. Alleles of TOP6B

Figure 3. Morphological phenotype of top6b mutants. (A) top6b seedling phenotype. A population of seeds segregating for each allele was plated, cold-treated for 24 h at 4°C, and grown under continuous light for 10 d. Plants with the homozygous phenotype are circled. Seedlings not circled are wild-type segregants. (B) top6b mutant phenotype after 5 wk growth. Seeds segregating for each allele were sown directly on soil, cold-treated for 48 h at 4 °C, then grown 7 d at 16°C under constant. Seedling were selected by phenotype, and transplanted to individual pots for continued growth at 16°C. Scale bars are 1 cm. (C) top6b phenotype after 10 wk of growth. Plants in (B) were grown for an additional 5 wk as described above. Scale bars are 1 cm.
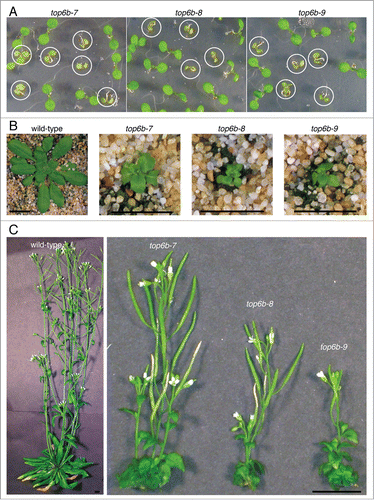
Figure 3. Morphological phenotype of top6b mutants. (A) top6b seedling phenotype. A population of seeds segregating for each allele was plated, cold-treated for 24 h at 4°C, and grown under continuous light for 10 d. Plants with the homozygous phenotype are circled. Seedlings not circled are wild-type segregants. (B) top6b mutant phenotype after 5 wk growth. Seeds segregating for each allele were sown directly on soil, cold-treated for 48 h at 4 °C, then grown 7 d at 16°C under constant. Seedling were selected by phenotype, and transplanted to individual pots for continued growth at 16°C. Scale bars are 1 cm. (C) top6b phenotype after 10 wk of growth. Plants in (B) were grown for an additional 5 wk as described above. Scale bars are 1 cm.

Table 2. Allelism tests of top6b-7 morphological phenotype

Table 3. Allelism test for IAA1-LUC degradation defects

Figure 4. Root growth inhibition in top6b-7 mutants with auxin treatment. Seeds were plated and grown on solid GM agar plates supplemented with the indicated concentration of 2,4-D for 7 d at 20°C with continuous lighting. The results are the combined data from three independent experiments. Values are mean ± 1 SD 59 ≤ n ≤ 68. The equations for linear regression are: y = −4.11(x) + 21.02, R2 = 0.0172; y = −129.32(x) + 16.44, R2 = 0.964; y = −83.98(x) + 7.91, R2 = 0.940 for axr1–30, Col, and top6b-7, respectively.
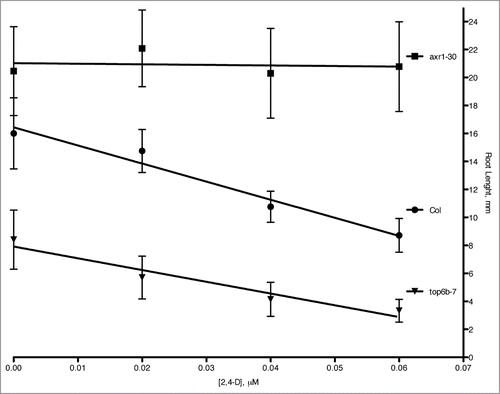
Figure 4. Root growth inhibition in top6b-7 mutants with auxin treatment. Seeds were plated and grown on solid GM agar plates supplemented with the indicated concentration of 2,4-D for 7 d at 20°C with continuous lighting. The results are the combined data from three independent experiments. Values are mean ± 1 SD 59 ≤ n ≤ 68. The equations for linear regression are: y = −4.11(x) + 21.02, R2 = 0.0172; y = −129.32(x) + 16.44, R2 = 0.964; y = −83.98(x) + 7.91, R2 = 0.940 for axr1–30, Col, and top6b-7, respectively.

Figure 5. IAA levels in top6b-7 mutants. Seeds segregating for top6b-7, were plated on GM, cold treated for 48 h at 4°C, and grown under constant light (50 μmol·m−1·s−2) at 20°C. Mutants and wild-type siblings were collected and sent for IAA measurement using LC-MS/MS. (A) IAA measurements are represented from 2 independent growth experiments. For each growth experiment, 3 different biological samples (S1-S3) for each phenotypic class were used for measurements. (B) The mean for the 6 replicates shown in (A) for each phenotypic class is shown, and are 10.39 and 6.26 ng IAA/g FW for top6b-7 and wild-type respectively. Bars are 1 sd. Averages are statistically different by a Student's t-Test (P = 5.84031*10−5, α = 0.05).
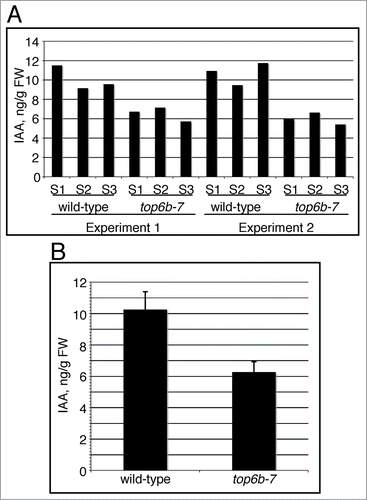
Figure 5. IAA levels in top6b-7 mutants. Seeds segregating for top6b-7, were plated on GM, cold treated for 48 h at 4°C, and grown under constant light (50 μmol·m−1·s−2) at 20°C. Mutants and wild-type siblings were collected and sent for IAA measurement using LC-MS/MS. (A) IAA measurements are represented from 2 independent growth experiments. For each growth experiment, 3 different biological samples (S1-S3) for each phenotypic class were used for measurements. (B) The mean for the 6 replicates shown in (A) for each phenotypic class is shown, and are 10.39 and 6.26 ng IAA/g FW for top6b-7 and wild-type respectively. Bars are 1 sd. Averages are statistically different by a Student's t-Test (P = 5.84031*10−5, α = 0.05).

Figure 6. DR5:GUS expression and responsiveness to 2,4-D in top6b-7. Seeds from a TOP6B/top6b-7 DR5:GUS plants were grown for 10 d on solid GM plates at 22°C, under constant light. Seedlings were then transferred to liquid GM and treated with either solvent or 50 μM 2,4-D for 24 h at 22°C, under constant light. Seedlings were stained for GUS activity for 24 h and 1 h for mock and 2,4-D samples respectively. Two representative seedlings are shown for each sample. Black arrowheads denote shoot apices, and white arrowheads denote the root apical meristems. Insets are enlargements of cotyledons to show GUS staining pattern.
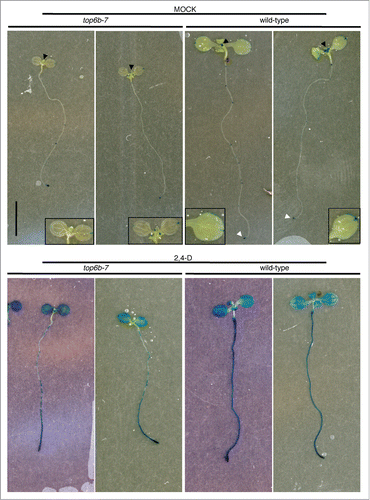
Figure 6. DR5:GUS expression and responsiveness to 2,4-D in top6b-7. Seeds from a TOP6B/top6b-7 DR5:GUS plants were grown for 10 d on solid GM plates at 22°C, under constant light. Seedlings were then transferred to liquid GM and treated with either solvent or 50 μM 2,4-D for 24 h at 22°C, under constant light. Seedlings were stained for GUS activity for 24 h and 1 h for mock and 2,4-D samples respectively. Two representative seedlings are shown for each sample. Black arrowheads denote shoot apices, and white arrowheads denote the root apical meristems. Insets are enlargements of cotyledons to show GUS staining pattern.

Reprints and Corporate Permissions

Please note: Selecting permissions does not provide access to the full text of the article, please see our help page How do I view content?

To request a reprint or corporate permissions for this article, please click on the relevant link below:

Academic Permissions

Please note: Selecting permissions does not provide access to the full text of the article, please see our help page How do I view content?

Obtain permissions instantly via Rightslink by clicking on the button below:

If you are unable to obtain permissions via Rightslink, please complete and submit this Permissions form. For more information, please visit our Permissions help page.