Figures & data
Figure 1 Effect of UV radiation on leaf and cell area after different days of UV radiation. Open asterisks indicate a statistically significant difference in leaf area between UV-treated and control plants, black asterisks indicate statistically significant difference in cell area (t-test, *p < 0.05, **p < 0.01, ***p < 0.001). Error bars indicate the standard error for five different leaves at all measured time-points and 600, 170 and 180 cells at day 0, 8 and 12 respectively.
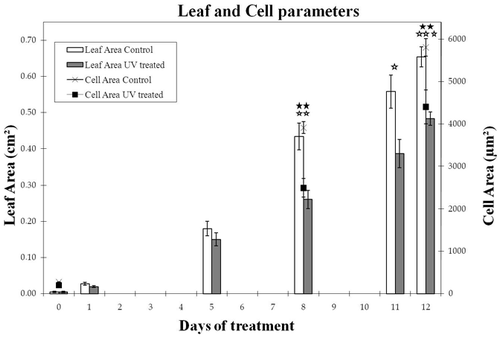
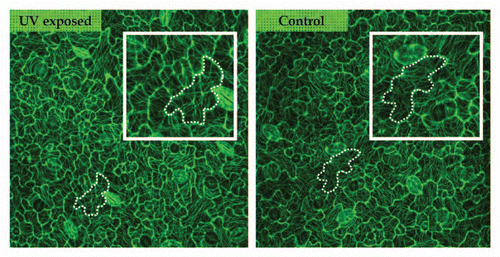
Figure 2 Microtubule pattern in control and UV-exposed leaves visualized using GFP-TUA6 and confocal microscopy. Both images are from cells at the mid zone of the fourth leaf at day 2. Microtubules are similarly arranged in equally shaped and sized cells of control and UV-exposed leaves. The marked cells show a pattern whereby the tubules are centred in the neck regions between two outgrowing lobes.