Figures & data
Figure 1 Phylogenetic tree of SEO proteins from different plants and the corresponding species tree. The phylogenetic tree was constructed using FastTree2,Citation16 on a T-CoffeeCitation17 alignment of the SEO protein sequences. Branch lengths are proportional to the number of amino acid substitutions. The shaded parts of the tree represent the subgroups previously identified with OrthoMCL.Citation7,Citation11 SEO proteins are represented as colored dots (color indicates the species). SEO-F proteins that have been confirmed as forisome components are shown as colored squares. The species tree, including all analyzed plants, was prepared according to the Angiosperm Phylogeny Group.Citation10
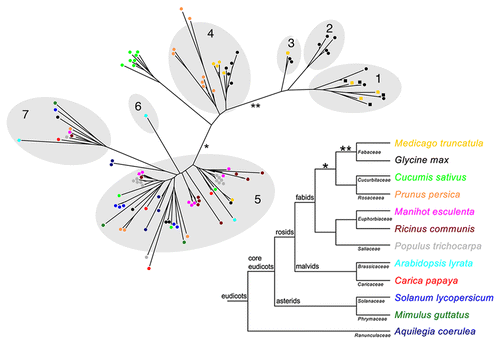
Table 1 Newly identified SEO genes in plants with recently published genome data