Figures & data
Table 1. Characteristics of study population
Figure 1. Genome-wide analysis of 875,967 SNPs in 12 cases of SCLS and 18 control subjects. (A) Manhattan plot showing negative log-transformed P values of the case-control allele frequency significance on the y-axis. The color scale of the x-axis denotes chromosome numbers. Gene names associated with individual dots indicate SNPs of greatest significance or with potential disease relevance. (B) Distribution of 653 SNPs meeting the established criterion for genome-wide significance (P ≤ 1 × 10⁻³, Chi square test). (C) Expanded view of chromosomes 6–7, which contain regions of neighboring SNPs highly associated with SCLS.
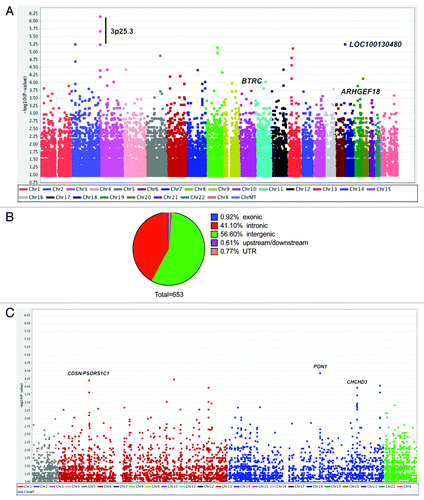
Table 2. Highly ranked SNPs associated with SCLS
Table 3. SCLS associated SNPs detected by both exome sequencing and SNP array
Table 4. Impact of non-synonymous mutations detected by SNP-chip and/or WES
Table 5. Functional enrichment analysis of top ranked SNPs
Figure 2. Functional enrichment of SCLS-associated SNPs. (A, B) 2-D heat maps representing genes containing SNPs significantly associated with SCLS and their associated functional annotation terms, as determined by the DAVID software algorithm. Related genes are portrayed on the x-axis and their corresponding annotations on the y-axis. Green areas represent positively reported gene-term association whereas black areas denote no gene-term association yet reported. Functionally enriched categories related to endothelial barrier dysregulation in SCLS included “cell projections” (A) and “cell adhesion” (B).
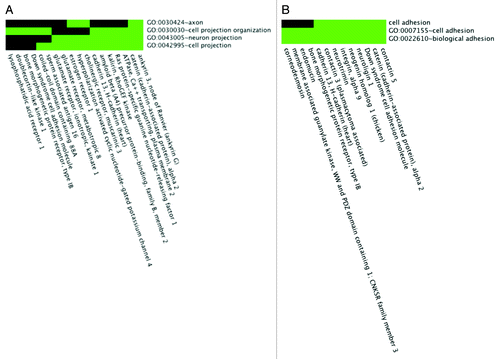
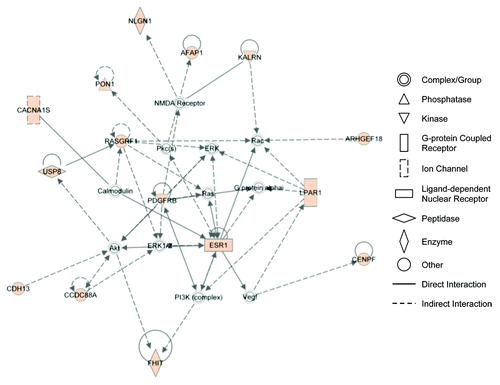
Figure 3. IPA network analysis reveals association of genes related to cytoplasmic/cytoskeletal organization. A list of 134 genes containing 653 SNPs associated with SCLS were uploaded for core analysis using Ingenuity Pathways Knowledge Base as reference. The network has been simplified for clear illustration of genes of interest. Colored symbol are genes contained on the list. Symbol shapes correspond to molecular functions as indicated. Direct or indirect interactions are shown by complete or dashed lines, respectively