1,398
Views
16
CrossRef citations to date
0
Altmetric
Research Paper

Lafora disease E3 ubiquitin ligase malin is recruited to the processing bodies and regulates the microRNA-mediated gene silencing process via the decapping enzyme Dcp1a

, , &
Pages 1440-1449 | Received 21 Aug 2012, Accepted 29 Oct 2012, Published online: 06 Nov 2012

Figures & data

Figure 1. Recruitment of malin to the PBs. (A) Representative images showing subcellular localization of transiently expressed GFP-tagged malin in HeLa cells. Note the punctate cytoplasmic granules of malin (identified with arrowheads). (B) Bar diagram showing the frequency of cells showing the punctate cytoplasmic granules (as shown in (A) for the GFP-tagged malin in HeLa cells upon treatment with puromycin or zinc or without any treatment (control), as indicated (***, p < 0.0005; t-test; n = 3). (C) Representative images showing the colocalization of Myc-tagged malin with the PB marker Ago2 (GFP-tagged) or GFP tagged malin with Dcp1a (RFP-tagged) in HeLa cells when transiently coexpressed. (D) Representative images showing the colocalization pattern of transiently expressed malin (Myc-tagged) with endogenous markers for PBs—the GW182 and Xrn1, as indicated. Scale bar, 10 μM (A, C-D).
Figure 1. Recruitment of malin to the PBs. (A) Representative images showing subcellular localization of transiently expressed GFP-tagged malin in HeLa cells. Note the punctate cytoplasmic granules of malin (identified with arrowheads). (B) Bar diagram showing the frequency of cells showing the punctate cytoplasmic granules (as shown in (A) for the GFP-tagged malin in HeLa cells upon treatment with puromycin or zinc or without any treatment (control), as indicated (***, p < 0.0005; t-test; n = 3). (C) Representative images showing the colocalization of Myc-tagged malin with the PB marker Ago2 (GFP-tagged) or GFP tagged malin with Dcp1a (RFP-tagged) in HeLa cells when transiently coexpressed. (D) Representative images showing the colocalization pattern of transiently expressed malin (Myc-tagged) with endogenous markers for PBs—the GW182 and Xrn1, as indicated. Scale bar, 10 μM (A, C-D).

Figure 2. Malin regulates the recruitment of Dcp1a to PBs. (A) Bar diagram showing frequency of cells having Dcp1a or Ago2-positive PBs in HeLa cells cotransfected with the expression constructs as indicated (***, p < 0.0005; t-test; n = 3). (B) Representative images showing the colocalization pattern of wild-type malin or its mutant forms—C26S mutation affecting the RING domain, and deletion mutant F216_D233 del (identified as “NHL del”) affecting the carboxyl-terminal NHL domain—when coexpressed with the RFP-tagged Dcp1a in HeLa cells. Both mutants are known to cause LD in recessive condition, and are shown to lack E3 ubiquitin ligase activity.Citation31 Note the absence of Dcp1a positive PBs in the cell that had higher levels of wild-type malin expression and the presence of Dcp1a-positive PBs in the cell that had lower expression of wild-type malin (identified by arrows). No such difference was noted when malin mutants were coexpressed.
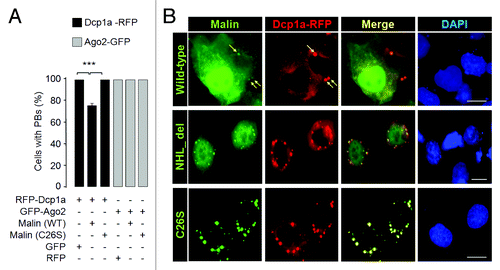
Figure 2. Malin regulates the recruitment of Dcp1a to PBs. (A) Bar diagram showing frequency of cells having Dcp1a or Ago2-positive PBs in HeLa cells cotransfected with the expression constructs as indicated (***, p < 0.0005; t-test; n = 3). (B) Representative images showing the colocalization pattern of wild-type malin or its mutant forms—C26S mutation affecting the RING domain, and deletion mutant F216_D233 del (identified as “NHL del”) affecting the carboxyl-terminal NHL domain—when coexpressed with the RFP-tagged Dcp1a in HeLa cells. Both mutants are known to cause LD in recessive condition, and are shown to lack E3 ubiquitin ligase activity.Citation31 Note the absence of Dcp1a positive PBs in the cell that had higher levels of wild-type malin expression and the presence of Dcp1a-positive PBs in the cell that had lower expression of wild-type malin (identified by arrows). No such difference was noted when malin mutants were coexpressed.

Figure 3. Malin regulates the recruitment of Dcp1a to the PBs. (A) Bar diagram showing frequency of cells having PBs that are positive both for Dcp1a and Ago2 when they were coexpressed with the wild-type malin or its mutant C26S, as indicated (***, p < 0.0005; t-test; n = 3). (B) A bar diagram showing the number of endogenous Dcp1a-positive PBs observed per cell when the cells were transfected with the RNAi construct to knockdown malin, or with the non-silencing RNAi (NS-RNAi) construct, as indicated (***, p < 0.0005; t-test; n = 3). (C) Bar diagram showing number of Dcp1a-, or Ago2-positive PBs observed per cell when Dcp1a or Ago2 was transiently expressed with the knockdown construct for, malin or the non-silencing control RNAi (NS-RNAi) construct, as indicated (***, p < 0.0005; t-test; n = 3). (D) Representative images showing the Dcp1a- or Ago2-positive PBs in HeLa cells transfected with the malin and non-silencing RNAi (NS-RNAi) constructs as indicated. Scale bar, 10 μM.
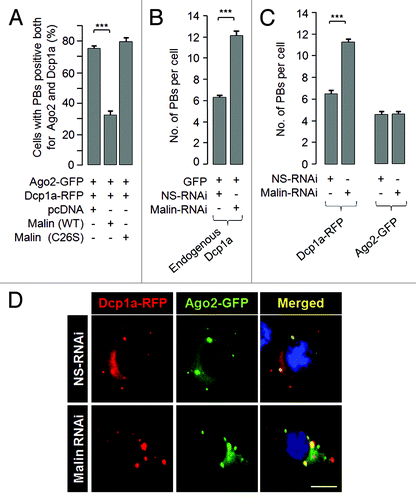
Figure 3. Malin regulates the recruitment of Dcp1a to the PBs. (A) Bar diagram showing frequency of cells having PBs that are positive both for Dcp1a and Ago2 when they were coexpressed with the wild-type malin or its mutant C26S, as indicated (***, p < 0.0005; t-test; n = 3). (B) A bar diagram showing the number of endogenous Dcp1a-positive PBs observed per cell when the cells were transfected with the RNAi construct to knockdown malin, or with the non-silencing RNAi (NS-RNAi) construct, as indicated (***, p < 0.0005; t-test; n = 3). (C) Bar diagram showing number of Dcp1a-, or Ago2-positive PBs observed per cell when Dcp1a or Ago2 was transiently expressed with the knockdown construct for, malin or the non-silencing control RNAi (NS-RNAi) construct, as indicated (***, p < 0.0005; t-test; n = 3). (D) Representative images showing the Dcp1a- or Ago2-positive PBs in HeLa cells transfected with the malin and non-silencing RNAi (NS-RNAi) constructs as indicated. Scale bar, 10 μM.

Figure 4. Malin promotes the degradation of Dcp1a. (A) Immunoblot showing the cellular level of endogenous Dcp1a in HeLa cells transiently transfected with the indicated expression constructs and probed for indicated proteins. Note the reduced levels of endogenous Dcp1a in the presence of wild-type malin (lane 2) and its rescue when the cells were treated with the proteasomal blocker MG132 (lane 4). The bar diagram shown below depicts the fold difference in the levels of endogenous Dcp1a (as measured by densiometric analysis) upon expressing the wild-type or the mutant form (C26S) of malin and when the cells were treated with MG132 as identified. (***, p < 0.0005; t-test; n = 3). (B and C) Immunoblot analysis for the lysates of the cells transfected with the expression constructs for RFP-tagged Dcp1a, GFP (in lanes 2-to-4) and increasing proportion of constructs (in lanes 3 and 4; identified by the slanting triangle on the top) for the wild-type (WT) (B) or the mutant form (C26S) of malin (C), as indicated. GFP served as the control for transfection efficiency. The bar diagrams shown below depicts the fold difference in the levels of RFP-tagged Dcp1a (as measured by densiometric analysis) when increasing concentration of wild-type (B) or mutant form of malin was coexpressed (C). (**,p < 0.005; ***, p < 0.0005; t-test; n = 3).
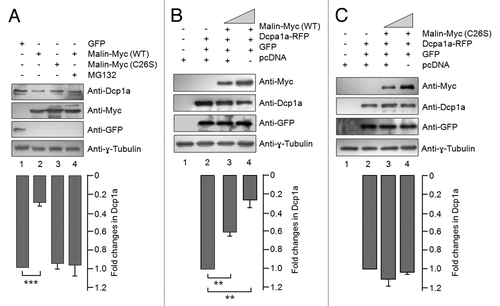
Figure 4. Malin promotes the degradation of Dcp1a. (A) Immunoblot showing the cellular level of endogenous Dcp1a in HeLa cells transiently transfected with the indicated expression constructs and probed for indicated proteins. Note the reduced levels of endogenous Dcp1a in the presence of wild-type malin (lane 2) and its rescue when the cells were treated with the proteasomal blocker MG132 (lane 4). The bar diagram shown below depicts the fold difference in the levels of endogenous Dcp1a (as measured by densiometric analysis) upon expressing the wild-type or the mutant form (C26S) of malin and when the cells were treated with MG132 as identified. (***, p < 0.0005; t-test; n = 3). (B and C) Immunoblot analysis for the lysates of the cells transfected with the expression constructs for RFP-tagged Dcp1a, GFP (in lanes 2-to-4) and increasing proportion of constructs (in lanes 3 and 4; identified by the slanting triangle on the top) for the wild-type (WT) (B) or the mutant form (C26S) of malin (C), as indicated. GFP served as the control for transfection efficiency. The bar diagrams shown below depicts the fold difference in the levels of RFP-tagged Dcp1a (as measured by densiometric analysis) when increasing concentration of wild-type (B) or mutant form of malin was coexpressed (C). (**,p < 0.005; ***, p < 0.0005; t-test; n = 3).

Figure 5. Malin interacts with and ubiquitinates Dcp1a. (A) Immunoblot showing the cellular levels of endogenous Dcp1a, GW182, and the transiently expressed GFP-tagged Ago2 in cells transfected with the RNAi construct for the knockdown of malin or a non-silencing control RNAi construct (NS-RNAi), as indicated. Probing for tubulin served as the loading control. Note that except Dcp1a, no other PB marker showed change in level on malin knockdown. For Ago2, the relative level was evaluated using an expression construct coding for GFP-tagged Ago2 and probed using anti-GFP antibody as indicated. (B) Immunoblot showing the levels of endogenous Dcp1a in two pairs of brain tissues of the malin knockout mice (KO) as compared with their wild-type littermates (WT). (C) Malin physically interacts with endogenous Dcp1a. Myc-tagged malin or an empty vector (pcDNA) was transiently expressed in HeLa cells and the cell lysates were processed for immunoprecipitation using anti-Myc antibody. The immunoprecipitate (IP) or the whole cell lysate (WCL) was probed with the indicated antibodies. The cells were pretreated with MG132 to arrest the degradation of Dcp1a. (D) Malin ubiquitinates Dcp1a. HeLa cells transiently transfected with an expression construct coding for RFP-tagged Dcp1a and wild-type malin or its catalytically inactive mutant form (C26S), treated with the proteasomal blocker MG132 and the cell lysate was immunoprecipitated (IP) using anti-ubiquitin antibody to trap the ubiquitinated proteins. The IP fraction and the whole cell lysates (WCL) were immunoblotted with indicated antibodies. Arrow identifies the expected molecular weight at which the full length Dcp1a-RFP should migrate (105 kDa).
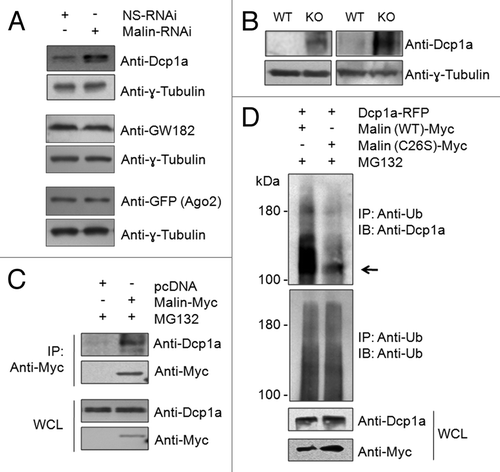
Figure 5. Malin interacts with and ubiquitinates Dcp1a. (A) Immunoblot showing the cellular levels of endogenous Dcp1a, GW182, and the transiently expressed GFP-tagged Ago2 in cells transfected with the RNAi construct for the knockdown of malin or a non-silencing control RNAi construct (NS-RNAi), as indicated. Probing for tubulin served as the loading control. Note that except Dcp1a, no other PB marker showed change in level on malin knockdown. For Ago2, the relative level was evaluated using an expression construct coding for GFP-tagged Ago2 and probed using anti-GFP antibody as indicated. (B) Immunoblot showing the levels of endogenous Dcp1a in two pairs of brain tissues of the malin knockout mice (KO) as compared with their wild-type littermates (WT). (C) Malin physically interacts with endogenous Dcp1a. Myc-tagged malin or an empty vector (pcDNA) was transiently expressed in HeLa cells and the cell lysates were processed for immunoprecipitation using anti-Myc antibody. The immunoprecipitate (IP) or the whole cell lysate (WCL) was probed with the indicated antibodies. The cells were pretreated with MG132 to arrest the degradation of Dcp1a. (D) Malin ubiquitinates Dcp1a. HeLa cells transiently transfected with an expression construct coding for RFP-tagged Dcp1a and wild-type malin or its catalytically inactive mutant form (C26S), treated with the proteasomal blocker MG132 and the cell lysate was immunoprecipitated (IP) using anti-ubiquitin antibody to trap the ubiquitinated proteins. The IP fraction and the whole cell lysates (WCL) were immunoblotted with indicated antibodies. Arrow identifies the expected molecular weight at which the full length Dcp1a-RFP should migrate (105 kDa).

Figure 6. Malin negatively regulates the let-7 miRNA-mediated gene silencing pathway. (A) Bar diagram showing the let-7 miRNA-mediated repression of a reporter construct. HeLa cells were transfected with shRNAi constructs for GW182, malin, or GFP and at 24 h post-transfection they were split into two sets and transfected again with a construct that code for renilla luciferase and having a target sequence for the endogenous let-7 miRNA (LetR-WT) or a mutated target site for the let-7 miRNA (Let7R-MT) and a construct that code for the firefly luciferase as indicated. The luciferase activity for each set was measured as ratio of firefly to renilla and was normalized with activity of control set (taken as 1 fold) and plotted as fold change in the miRNA-mediated repression of the reporter. Similar assay was done on cells that expressed the wild-type or the mutant form of malin in the place of the knockdown constructs(B), or in conditions of either malin knockdown, or Dcp1a knockdown or in cells were both malin and Dcp1a were knocked down (C) and the activity of the luciferase was measured. Each bar in A, B and C represents the mean of three independent experiments (***, p < 0.0005; t-test). (D) Immunoblot showing the level of Dicer in HeLa cells transfected with shRNAi for malin or a non-silencing shRNAi construct (NS-RNAi), as indicated. (E) Immunoblot showing the level of Dicer in the brain tissue lysates of malin knockout (KO) or their wild-type littermates (WT), as indicated. Two different pairs of animals were used for the immunoblot. The same blot shown in was used to probe with anti-Dicer antibody.
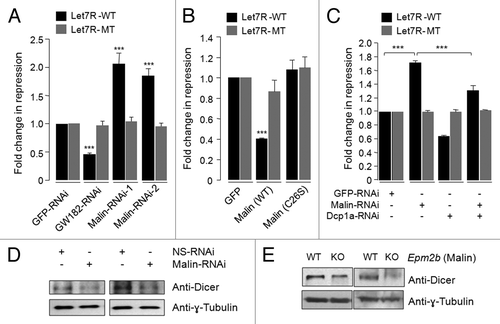
Figure 6. Malin negatively regulates the let-7 miRNA-mediated gene silencing pathway. (A) Bar diagram showing the let-7 miRNA-mediated repression of a reporter construct. HeLa cells were transfected with shRNAi constructs for GW182, malin, or GFP and at 24 h post-transfection they were split into two sets and transfected again with a construct that code for renilla luciferase and having a target sequence for the endogenous let-7 miRNA (LetR-WT) or a mutated target site for the let-7 miRNA (Let7R-MT) and a construct that code for the firefly luciferase as indicated. The luciferase activity for each set was measured as ratio of firefly to renilla and was normalized with activity of control set (taken as 1 fold) and plotted as fold change in the miRNA-mediated repression of the reporter. Similar assay was done on cells that expressed the wild-type or the mutant form of malin in the place of the knockdown constructs(B), or in conditions of either malin knockdown, or Dcp1a knockdown or in cells were both malin and Dcp1a were knocked down (C) and the activity of the luciferase was measured. Each bar in A, B and C represents the mean of three independent experiments (***, p < 0.0005; t-test). (D) Immunoblot showing the level of Dicer in HeLa cells transfected with shRNAi for malin or a non-silencing shRNAi construct (NS-RNAi), as indicated. (E) Immunoblot showing the level of Dicer in the brain tissue lysates of malin knockout (KO) or their wild-type littermates (WT), as indicated. Two different pairs of animals were used for the immunoblot. The same blot shown in Figure 5B was used to probe with anti-Dicer antibody.
Supplemental material

Additional material

Download Zip (676.1 KB)

Reprints and Corporate Permissions

Please note: Selecting permissions does not provide access to the full text of the article, please see our help page How do I view content?

To request a reprint or corporate permissions for this article, please click on the relevant link below:

Academic Permissions

Please note: Selecting permissions does not provide access to the full text of the article, please see our help page How do I view content?

Obtain permissions instantly via Rightslink by clicking on the button below:

If you are unable to obtain permissions via Rightslink, please complete and submit this Permissions form. For more information, please visit our Permissions help page.