Figures & data
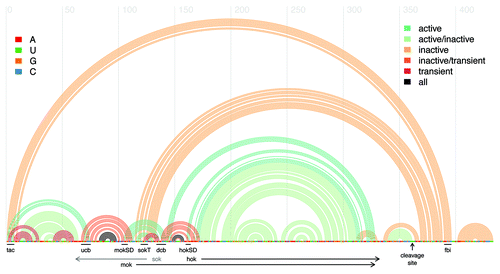
Figure 1. Arc plot of the mRNA for the Hok and Mok proteins, featuring the reference sequence from Escherichia coli plasmid R1, along with known structure motifs. Every arc represents a base-pair between the corresponding sequence positions. The legend at right corresponds to the arc colors, and indicates the structural conformation (active, inactive, or transient) in which the base-pair is found. The legend at left elucidates the identity of the nucleobases in the reference sequence. Annotated black lines indicate the positions of notable sequence motifs: tac, translational activator element; ucb, upstream complementary box; dcb, downstream complementary box; mok SD, mok Shine-Dalgarno sequence; hok SD, hok Shine-Dalgarno sequence; fbi, fold-back inhibitory element. Black horizontal arrows delineate the positions of the hok and mok protein-coding regions. Note that the sok antisense RNA is complementary to the region indicated by the gray horizontal arrow and not part of the hok/mok mRNA. The vertical black arrow denotes the position of the 3′ cleavage site. Figure generated using the R-chie program.Citation29

Table 1. Alignment properties relating to the three mapped structures: the active structure of the truncated hok mRNA, the inactive structure of the full-length mRNA and the transient upstream structures which form during hok transcription
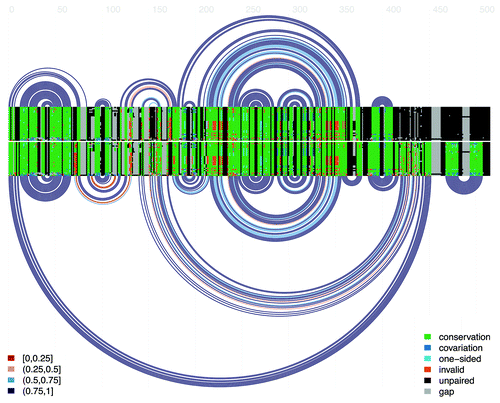
Figure 2. Double covariance plot and arc diagram for the alignment of the hok mRNA. The top covariance plot and arc diagram represents the active hok structure. Every arc represents a base-pair between the two respective columns of the alignment. For each pair of alignment columns in the structure, the bases of each sequence are colored according to their status, as indicated in the legend at right: green denotes conservation of the most common ordered base-pair in the pair of columns, dark blue indicates that the bases in both columns differ from the most common pair but retain base-pairing potential, light blue denotes a one-sided mutation in which base-pairing is retained, orange denotes the presence of mutations which invalidate base-pairing, black indicates nucleotides not involved in base-pairing and gray indicates the presence of alignment gaps. The lower covariance plot and arc diagram represent the inactive hok structure. Finally, the arc colors (presented in the legend at left) indicate the fraction of canonical base-pairs in the corresponding columns: red, 0–25%; orange, 25–50%; light blue 50–75%; dark blue, 75–100%. Figure generated using the R-chie program.Citation29
