Figures & data
Figure 1. Translation of the mouse MOR gene is controlled by 5′UTR-deletion analysis. (A) Schematic representation of the mouse MOR 5′-UTR. (B and C) Schematic representation of reporter constructs with wild type and deleted mouse MOR 5′-UTRs. The deleted sequences are described in Materials and Methods. Transient transfection of each deleted construct was performed in NS20Y cells. After transfection, cells were trypsinized and half were used for luciferase and β-galactosidase activity assays, while the other half were used for RNA extraction and transcript quantification. Relative LUC activity and mRNA levels were determined as the ratio of LUC/β-gal and LUC/LacZ as described in Materials and Methods. Error bars indicate the standard errors of triplicate LUC assays.
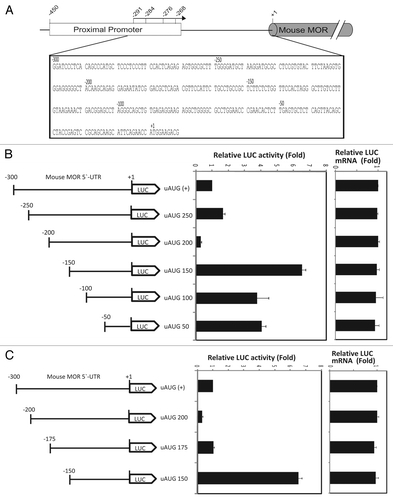
Figure 2. Schematic representation of the procedure for one-step purification of RNA binding proteins. (A) RNA oligonucleotides containing 25 nucleotide sequences with or without biotin label. (B) Outline of the modified one-step purification of RBPs using an affinity column. RNA oligonucleotides biotinylated on the 5′- or 3′-terminus were used as affinity particles. Cytosolic proteins were added to the affinity particles, incubated and washed. Proteins bound to the particles were released by heating in SDS sample buffer. Competitor experiments to eliminate non-specific proteins and to identify specific binding (filled star) were performed by preincubating the cytosolic proteins with a 2-fold excess of nonbiotinylated RNAs (Non B-175150) as competitors prior to affinity binding. (C) Coomassie-stained gel of RNA binding proteins purified from NS20Y cytosolic extracts with competitor. The competitor RNA sequences are shown in panel A.
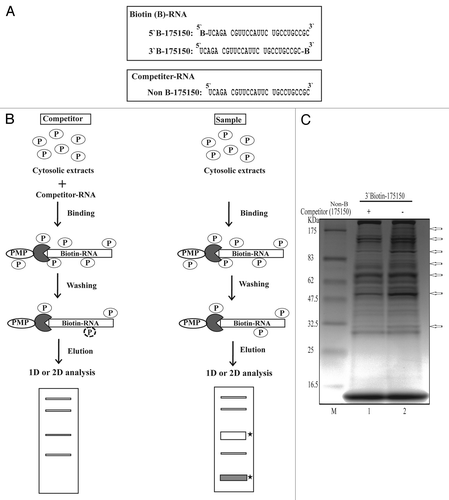
Figure 3. Simply Blue safe-stained 2-DE images of RBPs purified using an affinity column. Purified samples were separated on pH 3–10 IPG strips followed by separation by 4–20% SDS-PAGE. The competitor assay is shown in (A) and the sample assay shown in (B). Molecular weight markers are indicated on the left, and PI values are indicated the bottom. Arrows indicated spots that were subjected to analysis by MALDI-TOF mass spectrometry and bioinformatics. Detailed information for each spot is listed in .
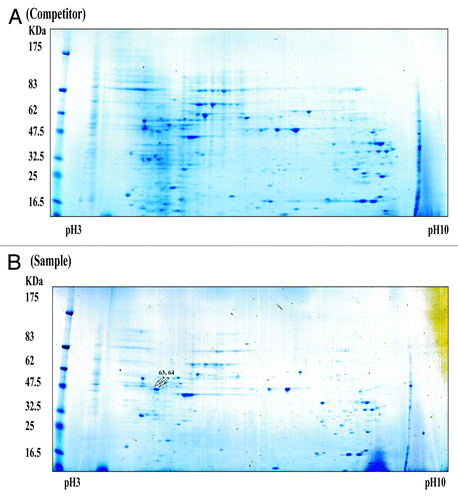
Table 1. Analysis by MALDI-TOF MS of tryptic peptide profiles
Figure 4. Identification of vimentin as a 175–150 RNA binding protein using a competitor via western blot analysis of purified RBPs performed with anti-vimentin antibodies. Vimentin protein levels were measured in NS20Y cells by western blotting after purification. Signal intensities were analyzed using ImageQuant 5.2 software.
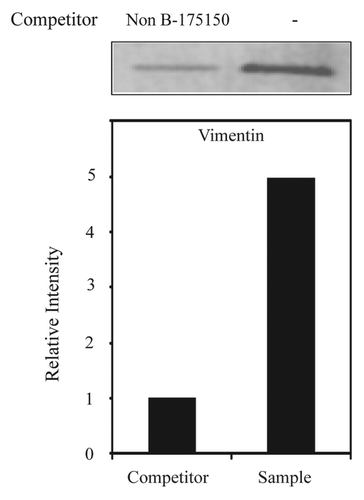
Figure 5. Interaction of vimentin with 175–150 RNA derived from the mouse MOR 5′-UTR. (A) The 25 bp of RNA sequence derived from mouse MOR 5′-UTR (between -175 and -150). (B) REMSAs were performed using 32P-labeled Non B-175150 as a probe with non-labeled purified RNPs by RNA-affinity purification. Lane 1, probe alone; lanes 2 and 5, purified RNPs without antibody; lanes 3 and 7, self-competitor without antibody; lanes 4 and 8, anti-vimentin; lanes 6 and 9, preimmune serum (PI). The arrow indicates the protein-RNA complexes and the star symbol indicates the shifted band corresponding to the probe. (C) Competitive REMSA experiments performed to assess the displacement of the probe complexed with the protein in the presence of excess molar concentrations (10, 50, 100, 150, 200 and 250×) of the unlabelled Non B-175150 oligonucleotide. The arrow indicates the protein-RNA complexes (D) REMSAs were performed using 32P-labeled Non B-175150 as a probe with non-labeled purified vimentin. Lane 1, probe alone; lanes 2 and 4, purified vimentin without competitor; lanes 3 and 5, purified vimentin with self-competitor. The arrow indicates the vimentin-RNA complexes. These data are representative of 2 independent experiments.
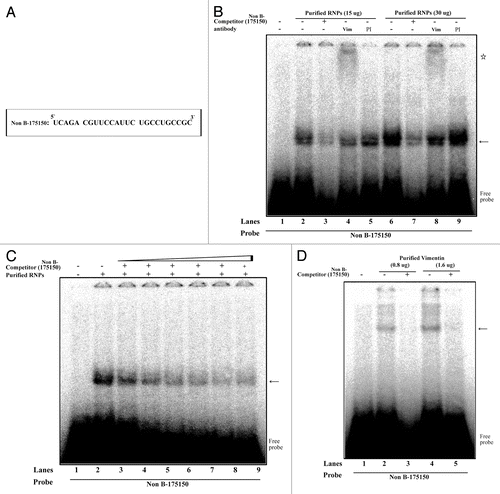
Figure 6. REMSA analysis of vimentin binding motif using mutant RNA-oligonucleotide sequences. (A) Representation of RNA-oligonucleotide sequence (Non B-175150) and mutant RNA-oligonucleotide sequences (175150-M1 ~175–150-M3). (B) REMSAs were performed using 32P-labeled wild-type (Non B-175150) and mutated oligonucleotides (175150-M1, M2 and M3) as probes with non-labeled purified RNPs by RNA-affinity purification. Lanes 1, 4, 7 and 10, probe alone; lanes 2, 5, 8 and 11, purified RNPs (15 ug) with indicated probe; lanes 3, 6, 9 and 12, purified RNPs (30 ug) with indicated probe. The arrow indicates the protein-RNA complexes. (C) Schematic representation of the binding motif for vimentin on the RNA sequence. These data are representative of 2 independent experiments.
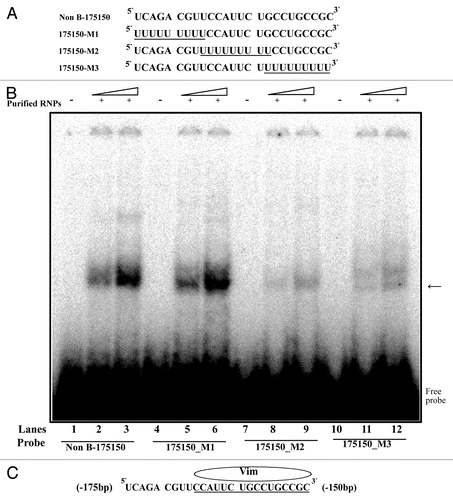
Figure 7. Mouse MOR expression levels in vimentin-transfected NS20Y and Neuro2A cells. Graphic representation of relative luciferase expression determined by luciferase assay (Promega) of the constructs shown in [uAUG (+)] with 2–4 μg of RBP expression constructs. Relative LUC activity and mRNA levels were determined as the ratio of LUC/β-gal and LUC/LacZ as described in Materials and Methods. *P and #P < 0.05 compared with non-treated control.
![Figure 7. Mouse MOR expression levels in vimentin-transfected NS20Y and Neuro2A cells. Graphic representation of relative luciferase expression determined by luciferase assay (Promega) of the constructs shown in Figure 1 [uAUG (+)] with 2–4 μg of RBP expression constructs. Relative LUC activity and mRNA levels were determined as the ratio of LUC/β-gal and LUC/LacZ as described in Materials and Methods. *P and #P < 0.05 compared with non-treated control.](/cms/asset/f1d8b123-123c-4baf-968a-141574e705f3/krnb_a_10923022_f0007.gif)